Introduction
The COVID-19 pandemic brought an undoubtedly change into our daily lives and has had many consequences on society, individual's and their behaviors. We would expect the COVID-19 pandemic, along with the lockdown restrictions, social distancing and reduced working opportunities, to have had an impact on the mental health of many individuals, but how to evaluate these effects?. To what degree did the COVID-19 pandemic correlate with mental health awareness?, how does it correlate with the real number of mental health cases?.
What data?
Wikipedia pageviews
Pageviews for certain online website pages can be used as an indicator of awarness towards specific topics. Although using pageviews as predictor or indicator of occurring events does have its downfalls(which we will address later), it can still be used as a powerful tool to measure awareness and popularity.
The next issue however, is where we can get reliable pageview statistics? With an average monthly number of 263 million pageviews per month targeted towards specific pages and topics, Wikipedia is the most popular online encyclopedia, furthermore Wikipedia provides us with detailed daily pageview statistics for specific pages and for specific languages.
But every country reacted differently
Pageviews for certain online website pages can be used as an indicator of awarness towards specific topics. Although using pageviews as predictor or indicator of occurring events does have its downfalls(which we will address later), it can still be used as a powerful tool to measure awareness and popularity.
The next issue however, is where we can get reliable pageview statistics? With an average monthly number of 263 million pageviews per month targeted towards specific pages and topics, Wikipedia is the most popular online encyclopedia, furthermore Wikipedia provides us with detailed daily pageview statistics for specific pages and for specific languages.
In order to to be able to get 'per country' level pageview data from Wikipedia, we will focus on the
articles that are written in languages used only within a single country, because for these articles we can
safely assume that for broad topics such as mental health, a majority of pageviews come from individuals
within these respective countries.
We will thus focus on the following 4 languages Italian, Dutch, Swedish and
Polish.
Furthermore picking these countries has the added benefit allowing us to compare data from countries who
have had different approaches towards the pandemic.
What does the data look like
The original pageview data was aggregated "per topic", so this gives us a timeseries of the aggregated number of pageviews for the topic of "Medicine and Health" over the initial period of covid lockdowns. Let us begin by plotting the pageviews of wikipedia articles related to "Medicine and Health" during the first lockdown period.
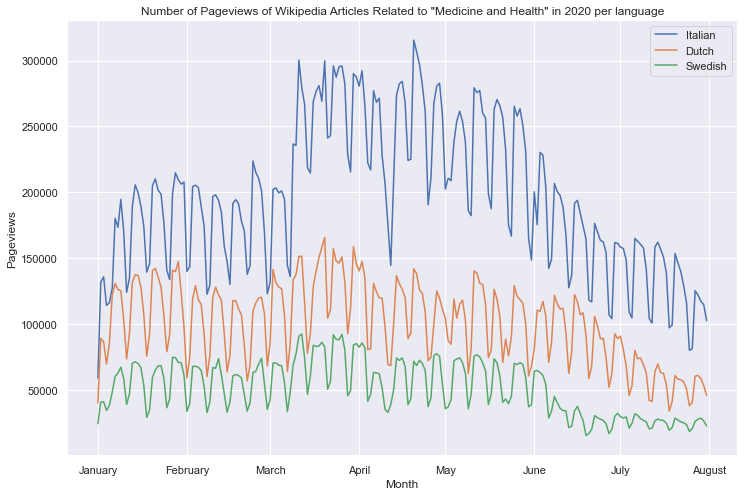
We can observe, there is indeed an increase in pageviews on wikipedia articles related to "medicine and health" during the months of lockdown for all languages, but what could be cause of this increase?, and do Mental Health topics follow the same trend?.
Mobility Data
The main purpose behind imposing lockdowns was to decrease the number of people each person meets, which subsequently lead to great changes in the mobility of people. As a result, millions of people were forced to make changes in their lives and find new daily routines. Hence, we think there is a good chance that there is a connection between changes in pageviews of Mental Health topics and changes in mobility. Before we dive further into our analysis, we shall introduce the mobiility datasets we used.
There are 2 mobility datasets available to us. Global mobility report by Google and Apple Mobility Trends. Further, we will refer to these datasets as Google and Apple one. Both of these datasets were collected using data from mobile devices.
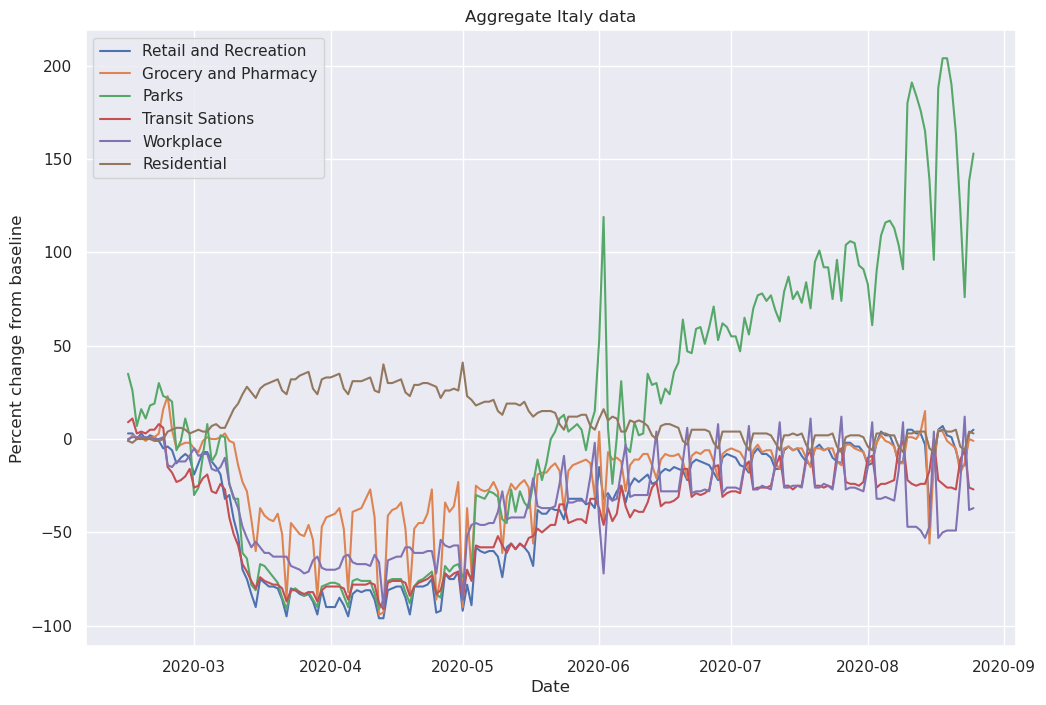
Google dataset is defined as a timeseries per day, where we have 6 categories of mobility - Retail and Recreation, Grocery and Pharmacy, Parks, Transit Stations, Workplace and Residential. For each date, category and country we have a value, which represents a percentage change compared to the baseline (period before the observed period). Let us consider data for Italy. As you can see in the figure below, there was a great change in mobility during lockdown. Some types of mobility were reduced by as much as 80%. Another interesting thing to notice is that in the plot we can clearly distinguish weekdays and weekends.
Apple chose different apporach towards their dataset. They measured precentage change in 3 categories - driving, walking and transit. It is important to note that this dataset uses different scale for percentage change - baseline is 100 instead of 0 - e.g. negative change of 50% is represented as 50, whereas it is -50 in Google dataset. Again, looking at the figure below we can clearly see the impact of lockdown on mobility in Italy.
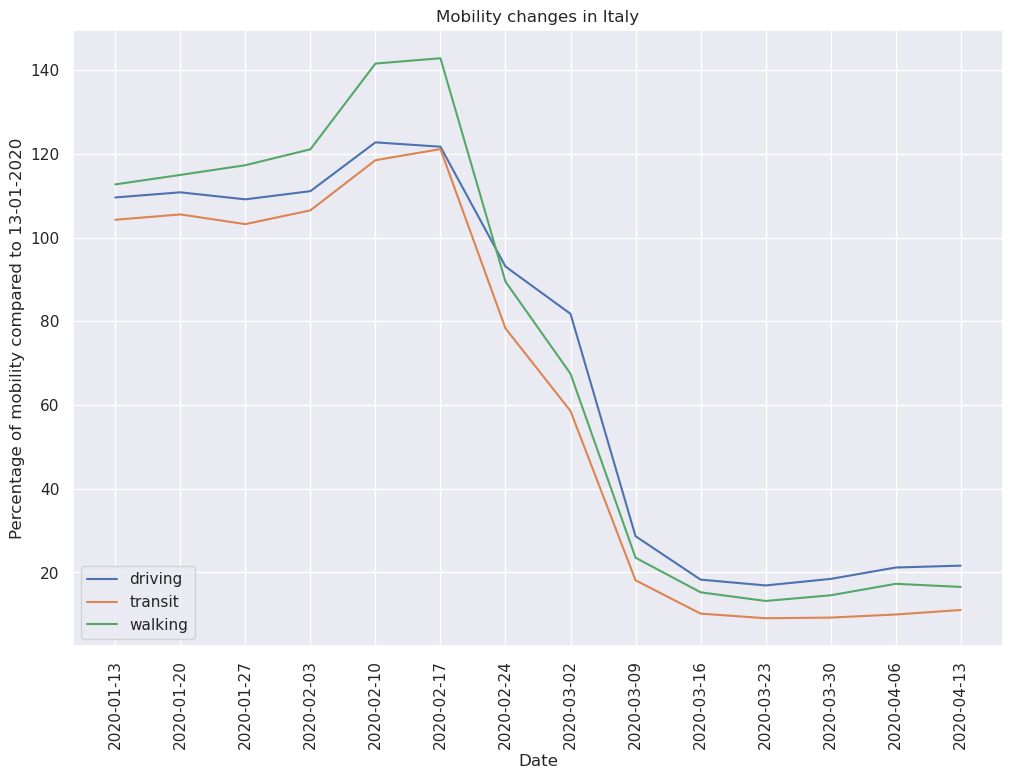
Inspecting the 2 figures further we can notice that both of these datasets have higly correlated features. Threfore, when appropriate, we will not use all the available features to us, and in case of Apple dataset, we will use an average of the 3 features.
Initial Approach
For this study we have decided to focus on 5 of the most common mental health issues who are often believed to have been aggravated by the pandemic. These topics are anxiety, depression, insomnia, loneliness and stress.
Let us first observe how the pageviews related to the specific pages of the 5 above mentioned mental health issues fluctuated during the initial covid lockdowns for each of the 4 considered languages. If so, in what way and on what mental health issues?
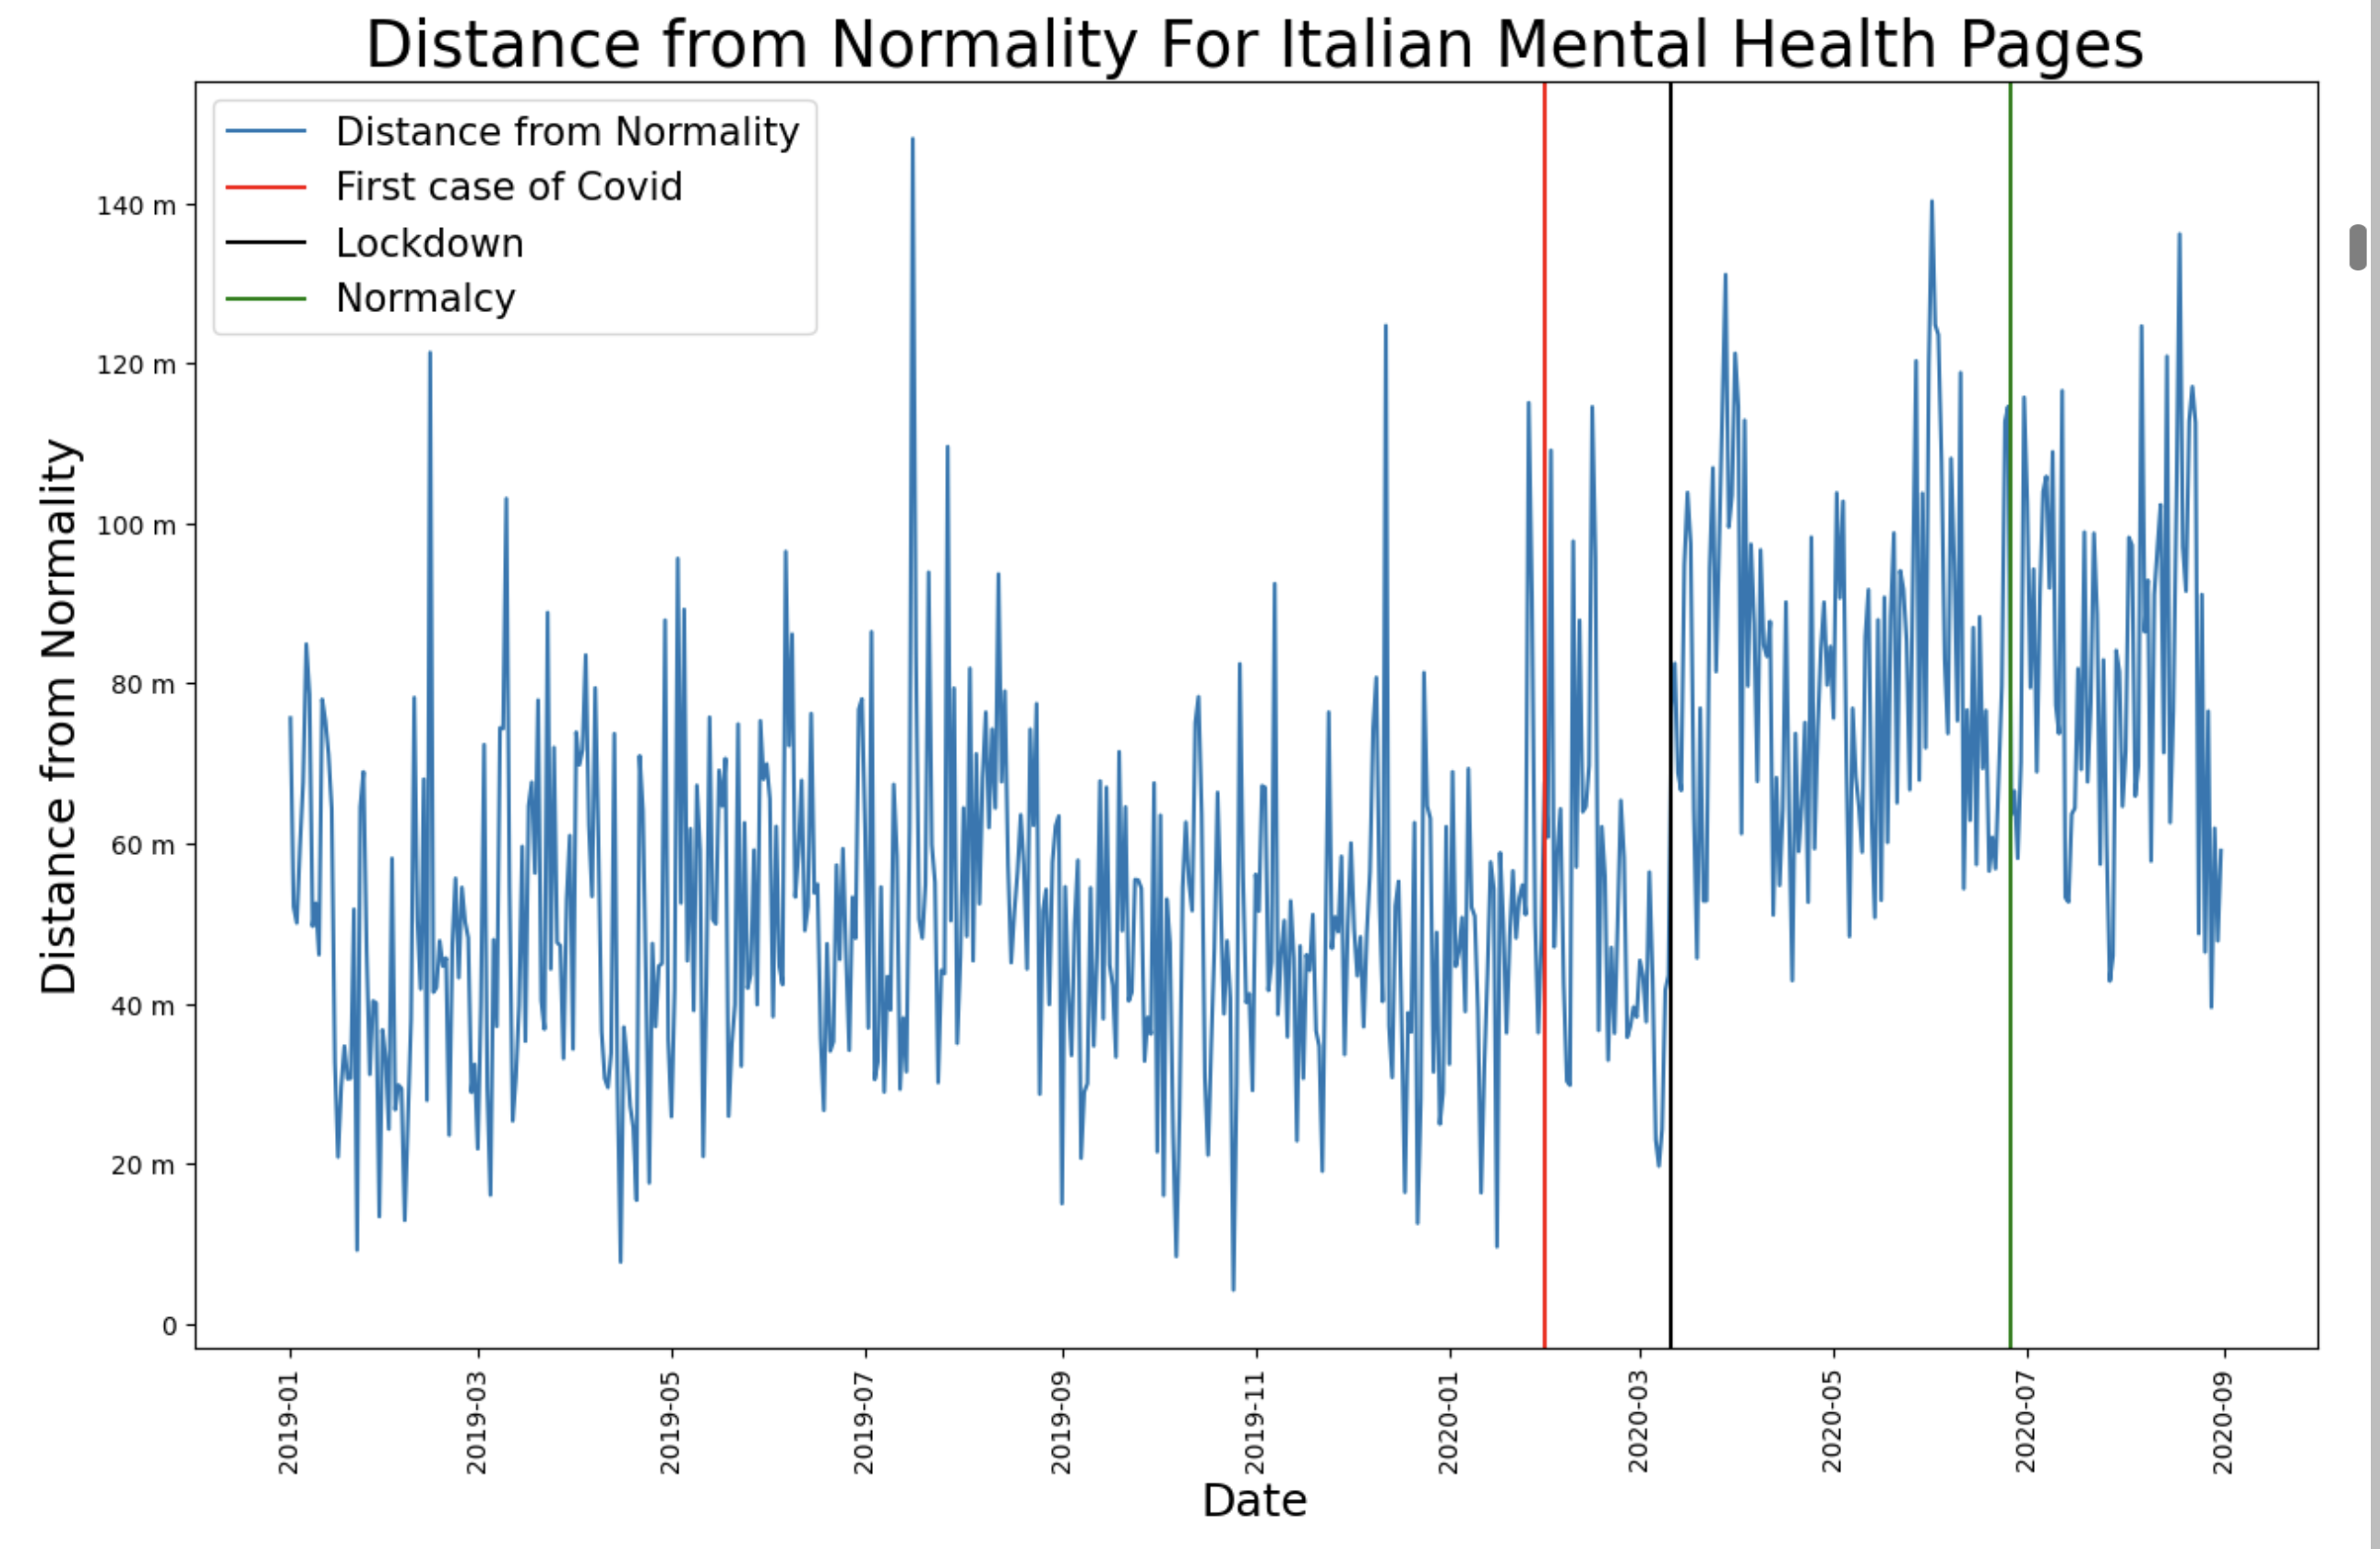
Distance from Normality
We will use distance from normality to measure the overall changes in the information-seeking patterns of Wikipedia users over our chosen mental health articles during the initial lockdown.
We introduce a notion of distance from normality as follows. On each day, the pageviews in a given language edition form a distribution over mental health articles, characterizing how users’ attention was distributed. We represent each daily distribution as an “attention vector” of dimension 5 with one entry per article and entries summing to 1.
The notion of “normal” attention is captured by the average attention vector over all days of 2019, i.e., well before the pandemic; and for each subsequent day, the distance from normality is given by the Euclidean distance of that day’s attention vector from the average attention vector. Notice that we calculated the attention vector separately for each language.
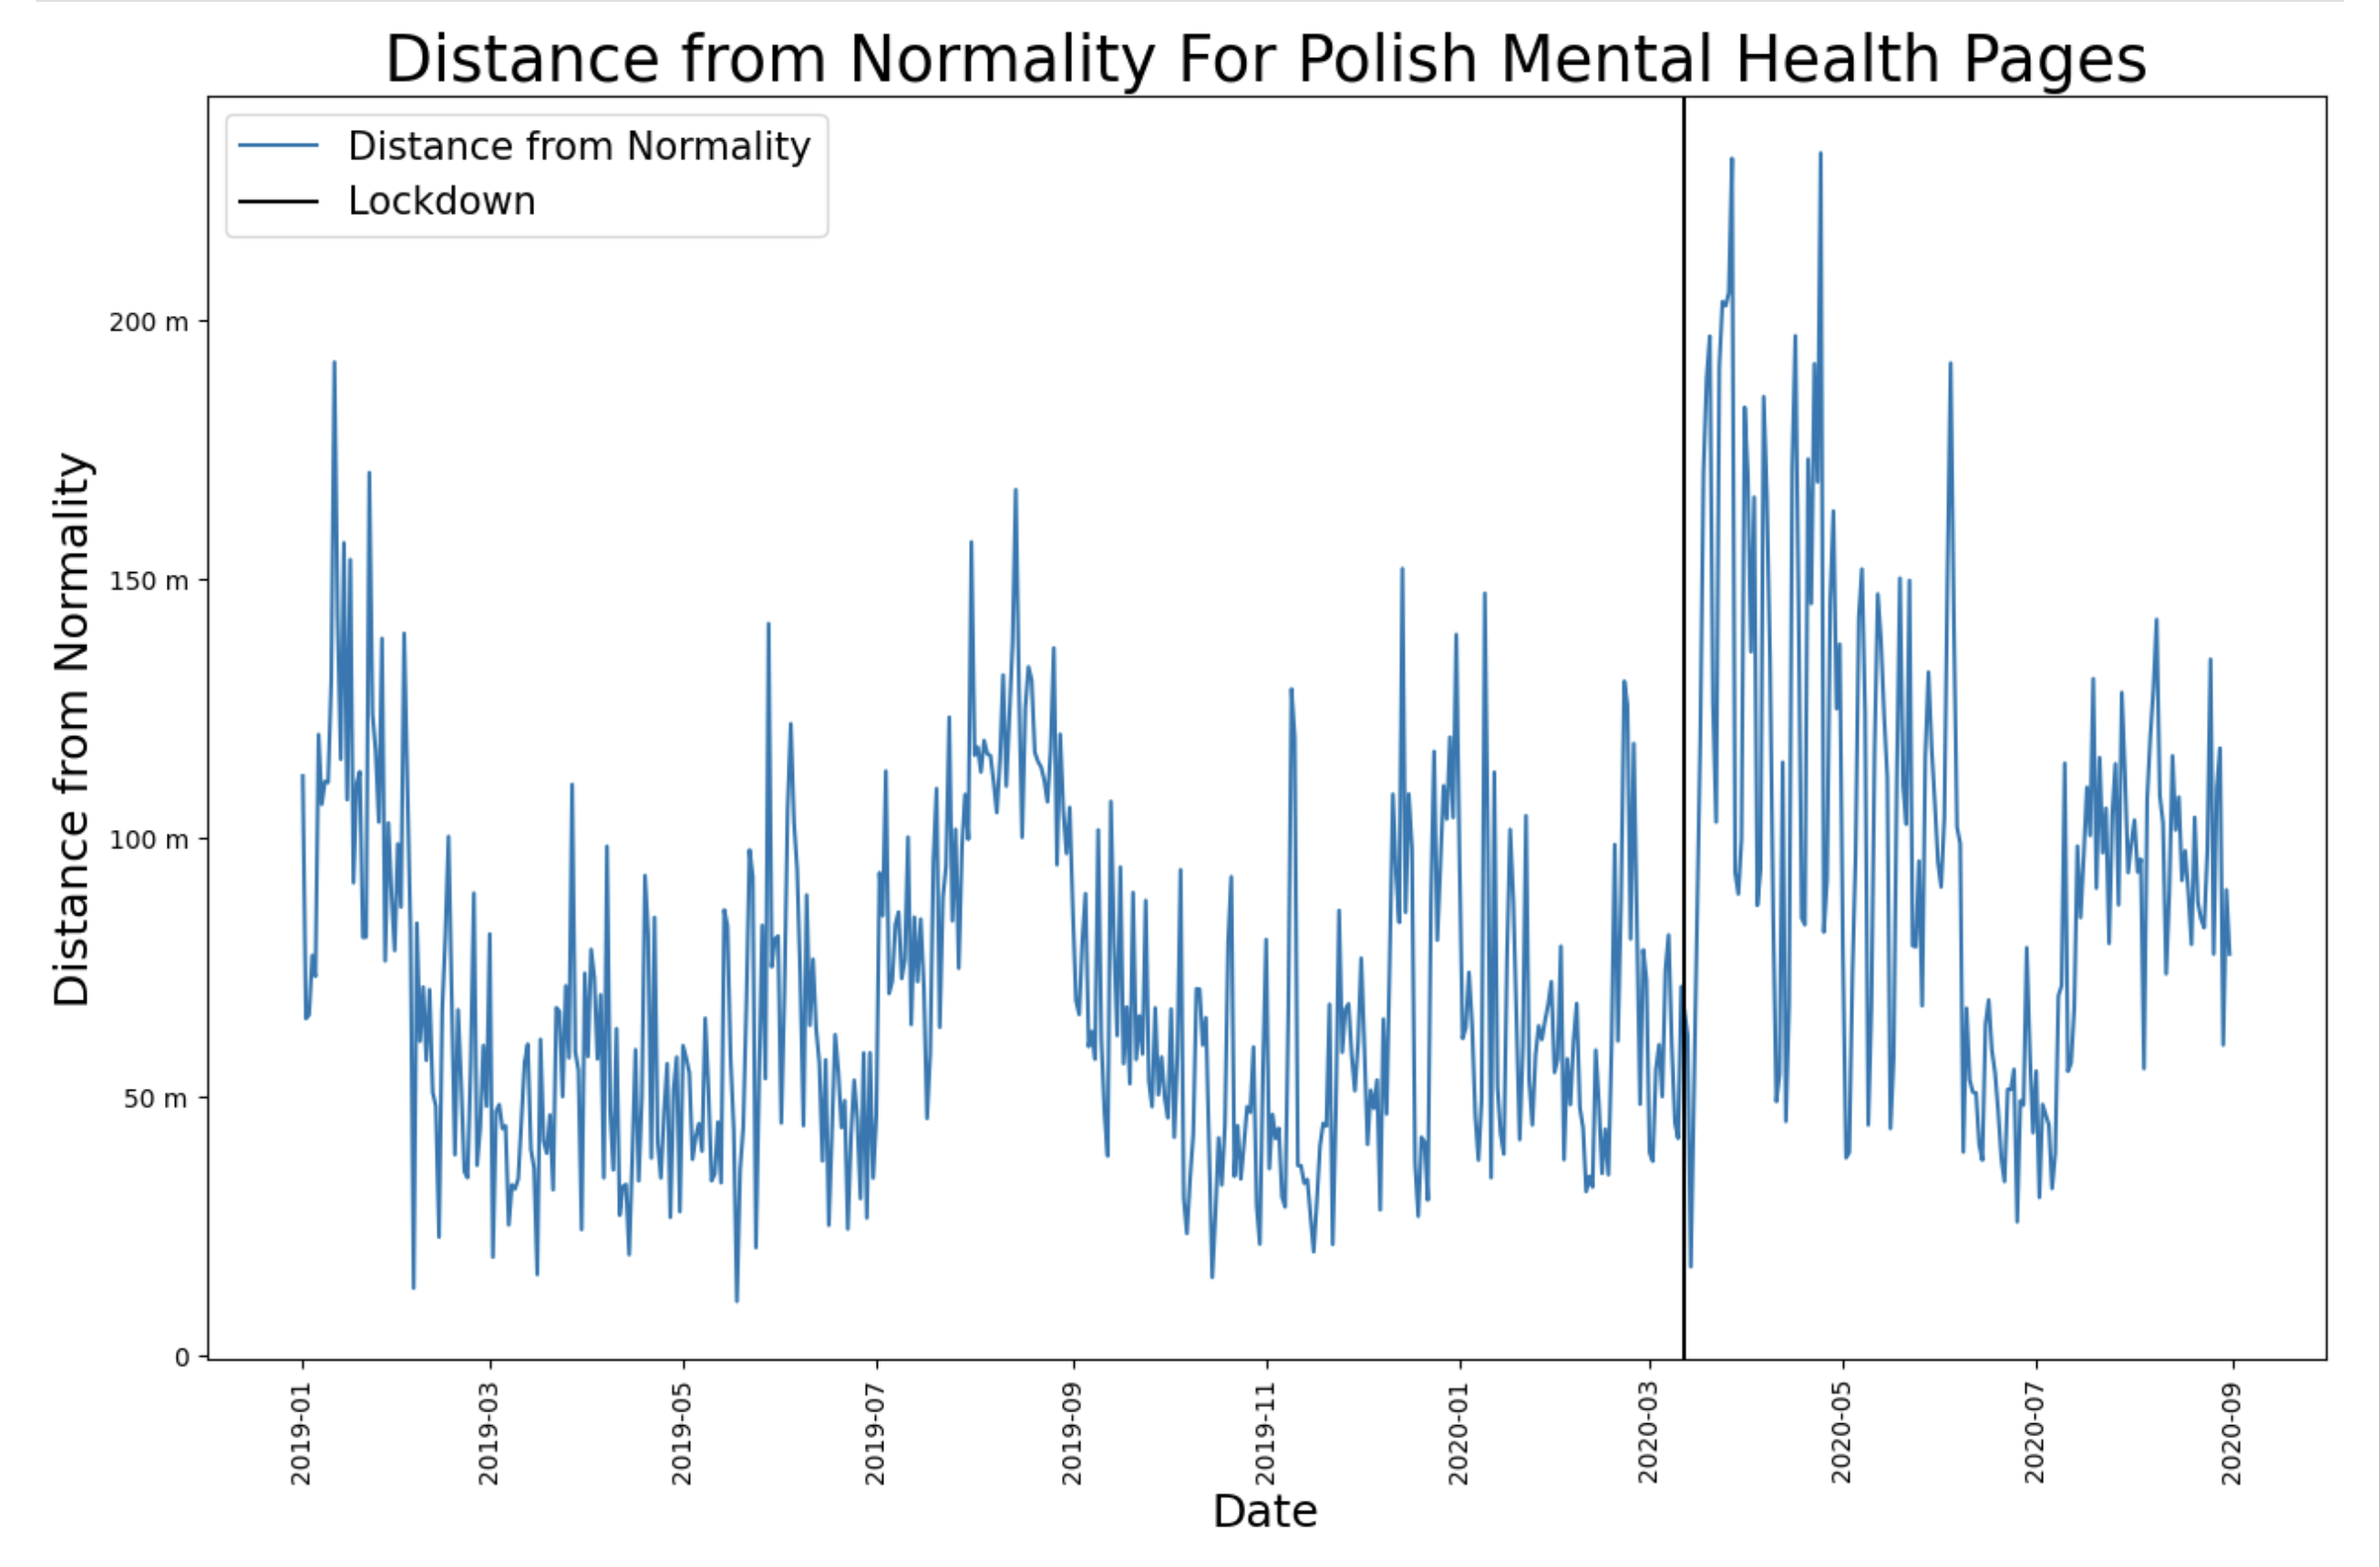
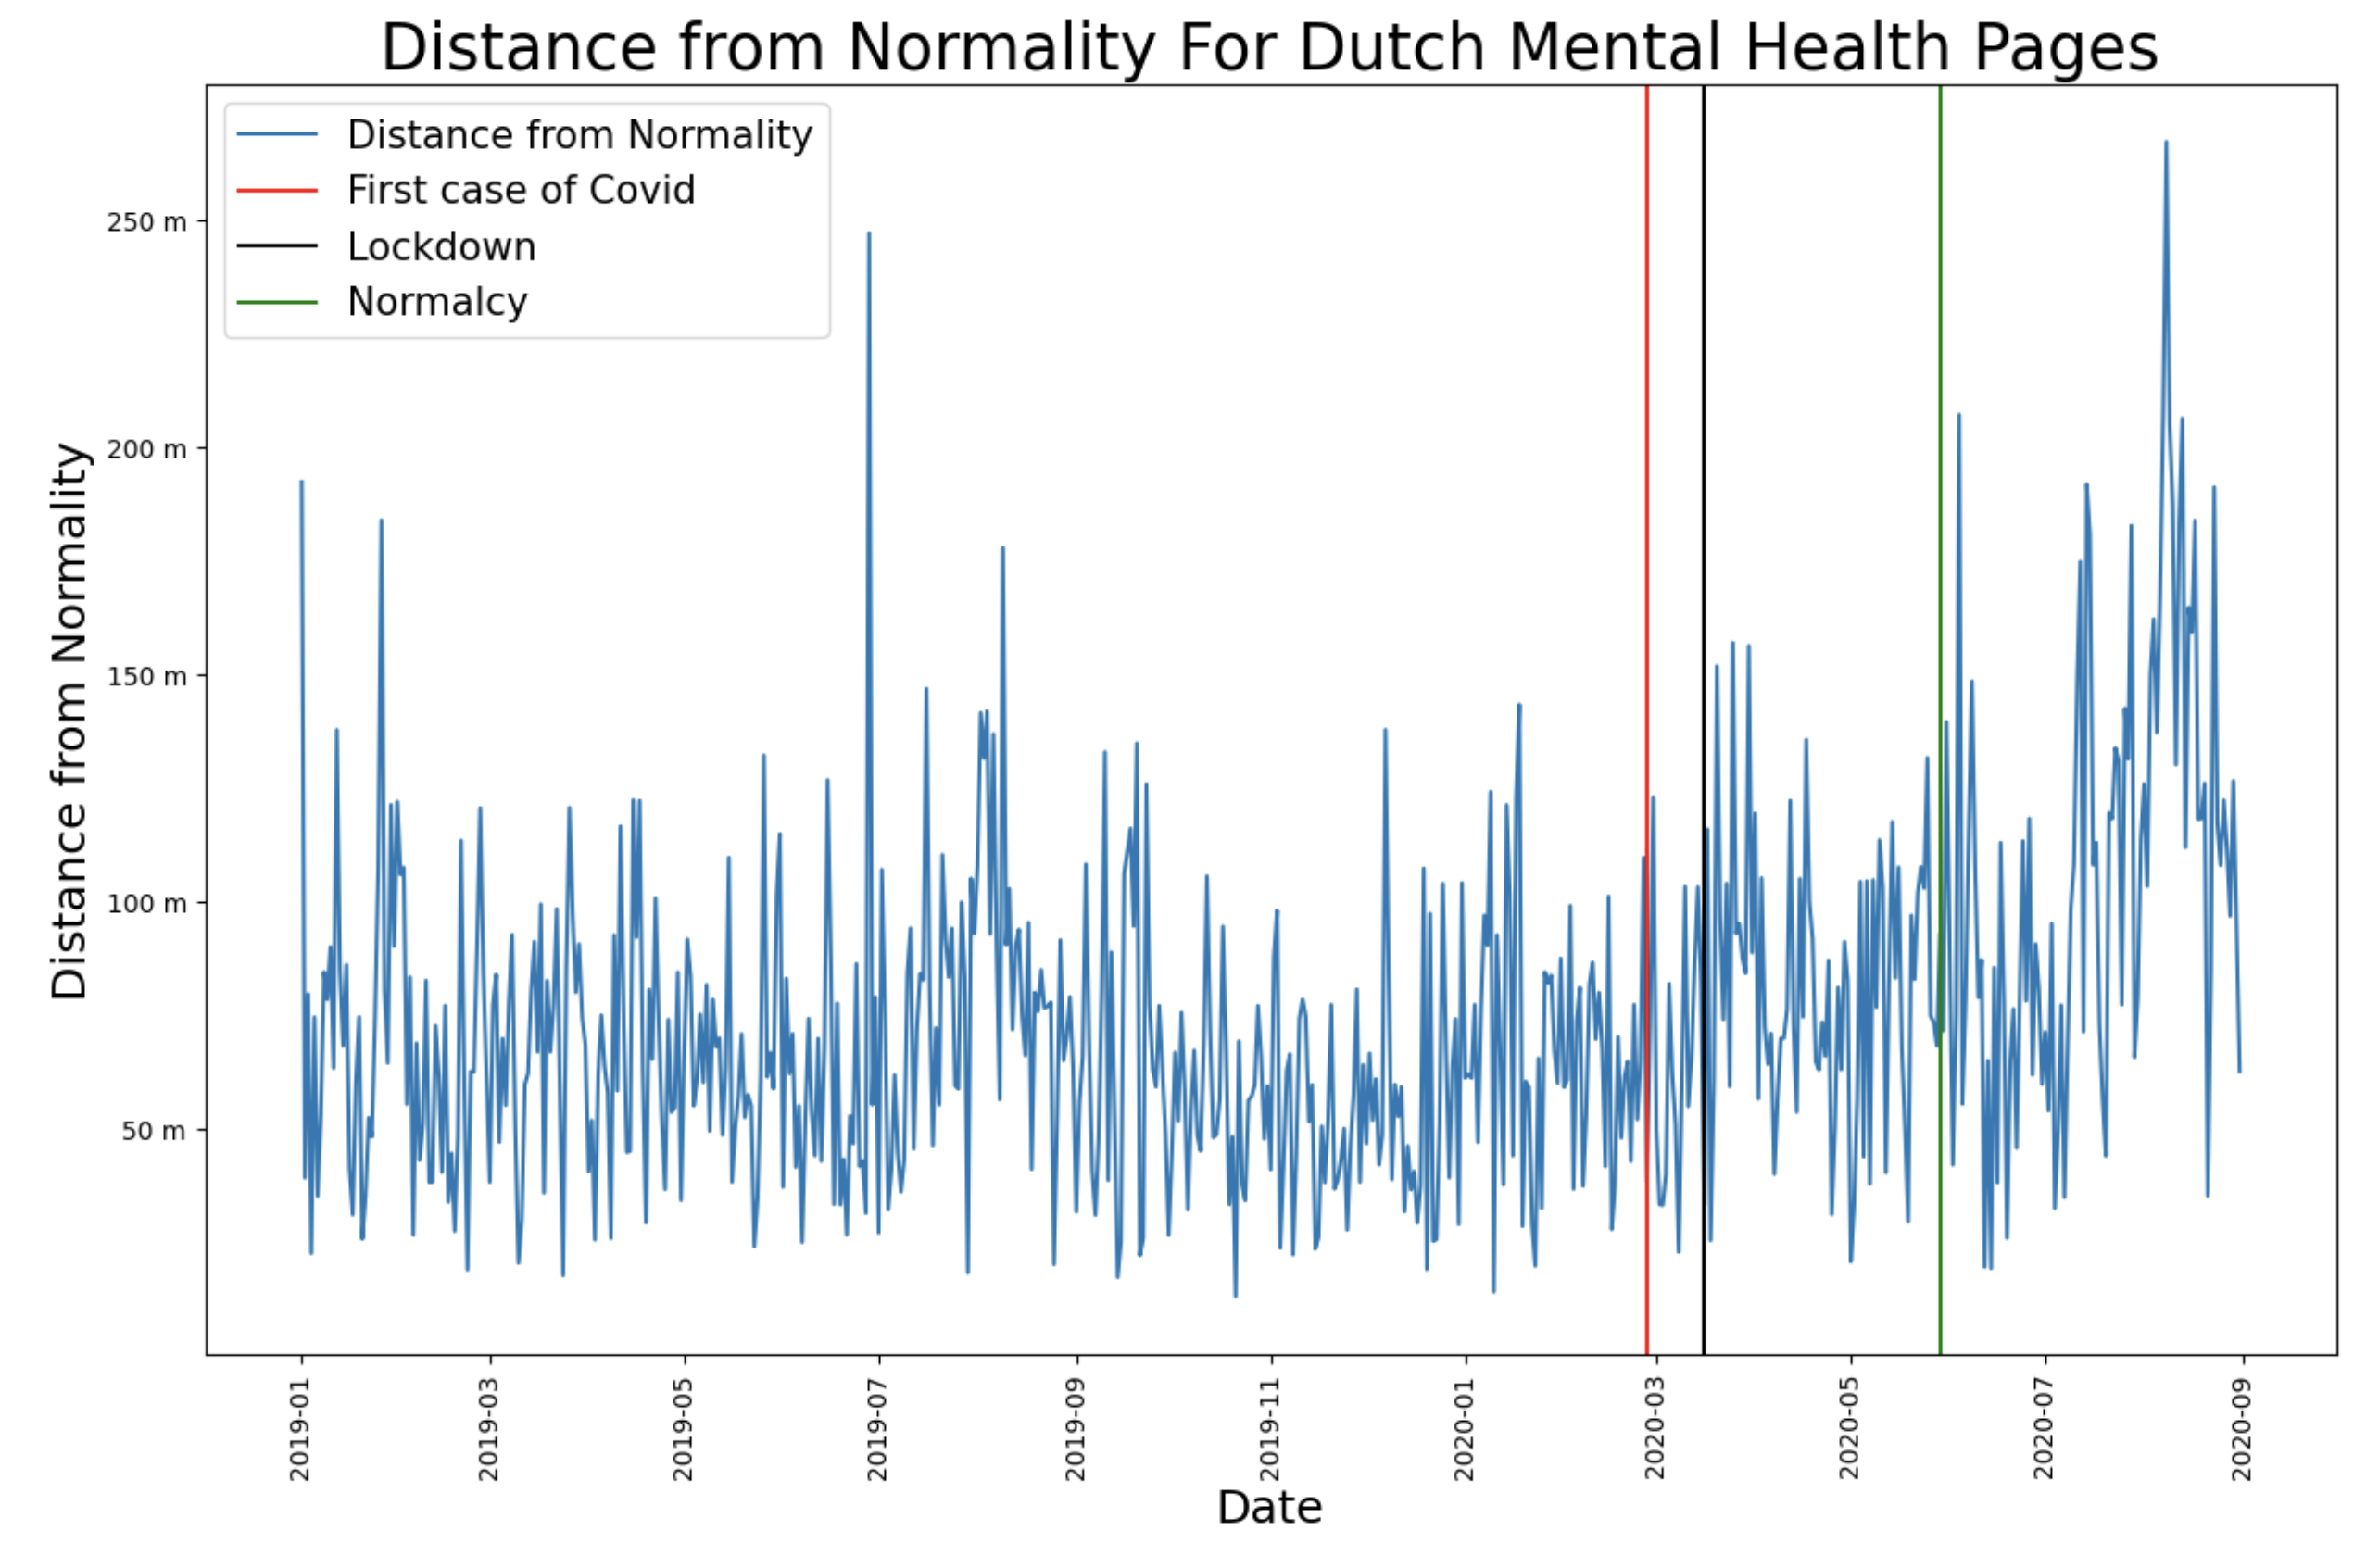
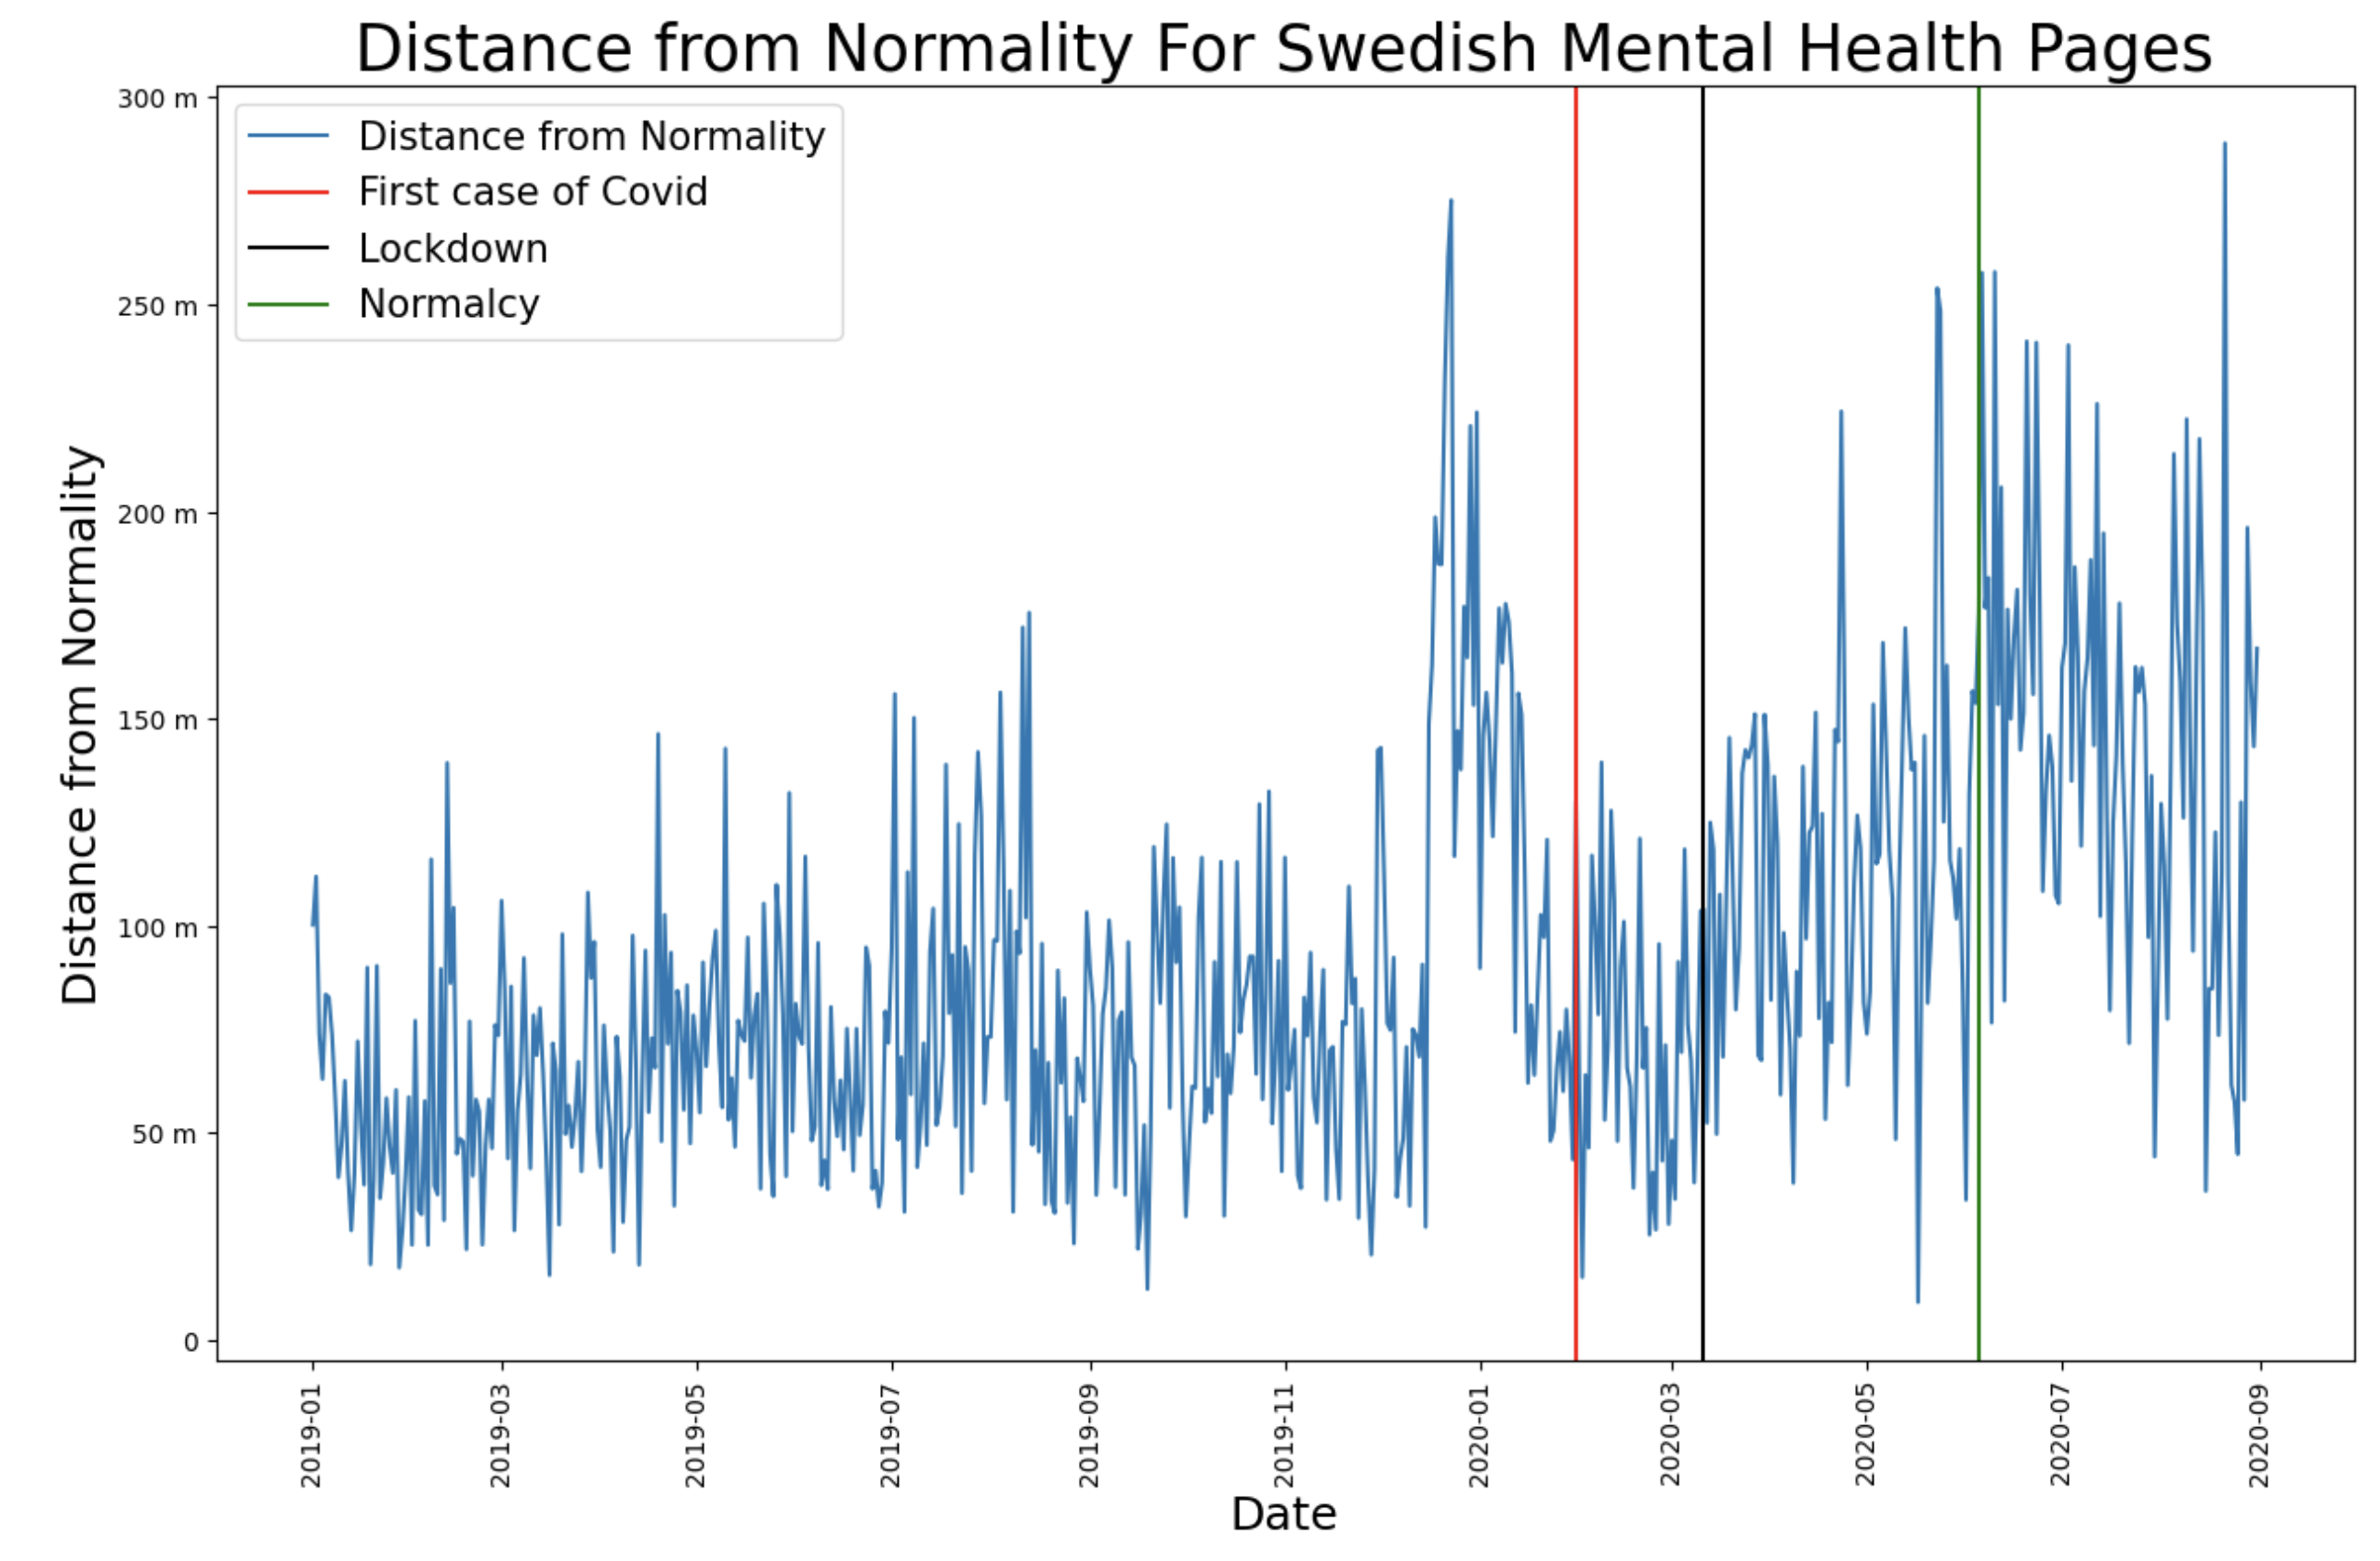
In the plots we see there has been some changes in distance from normality in Sweden, but they started before the lockdown (although Sweden did not have official lockdown, we consider the day mobility dropped). As for the Netherlands, there are no significant attention changes.
For Italy and Poland, the distance from the normality attention vector changed significantly during the lockdown, so for these countries, there has been some change in user's attention distribution between our chosen mental health topics after the lockdown. However, it is unclear in which direction these changes have taken place. To understand this and quantify changes in the volume of pageviews, we will use the difference in differences regression approach.
Difference-in-differences regression
Difference-in-differences regression is a “quasi-experimental” technique that mimics an experimental design with observational data by studying the effect of a treatment (e.g., lockdown) on a treatment group vs. a control group. The difference-in-differences method aims at separating the true treatment effect from simultaneous (e.g., seasonal) changes that would have occurred even without the treatment. To do so, we calculate the post-minus-pre-treatment difference (in 2020) and compare it to the difference between the corresponding time periods in the previous year (2019). Subtracting the 2019 difference from the 2020 difference (yielding the “difference in differences”) thus removes changes that would have occurred even without the intervention (assuming 2020 would otherwise have looked like 2019) and gives a better estimate of the treatment effect.
We will compare the difference in activity seven weeks before vs. seven weeks after the lockdown. The idea here is to capture what changes were introduced by the sudden halts in human mobility induced by non-phamaceutical interventions.
In this setup, we fix disease and consider, for each language, a time window of 14 weeks (98 days) split around either the lockdown date in 2020, as well as the corresponding time window in 2019. Each of these 196 days contributes one data point per language, for a total of 196 × 4 = 784 data points. As the dependent variable y, we use the logarithm of the number of page views, and as independent variables, the following three factors: year (2019 or 2020), lockdown (before or after the calendar day of lockdown), and language. We now model y as a linear function of these three factors and all their two and three-way interactions.
Pageview volumes were considered in logarithmic form for two reasons: first, because raw pageview counts are far from normally distributed, with numerous large outliers, and second, because the logarithm makes the model multiplicative, thus implicitly normalizing the estimated effects and making it possible to compare languages with different pageview volumes. E.g. if b is the coefficient of the three-way interaction year : lockdown : language, then exp(b) captures the multiplicative factor by which disease pageview volumes in a given language increased when lockdown happened, after taking into account differences related only to the year or only to lockdown, which are already captured by the coefficients of year : language and lockdown : language, respectively.
Results
For each mental health issue page views, we performed Difference-in-differences regression. For "anxiety" we got the following results:
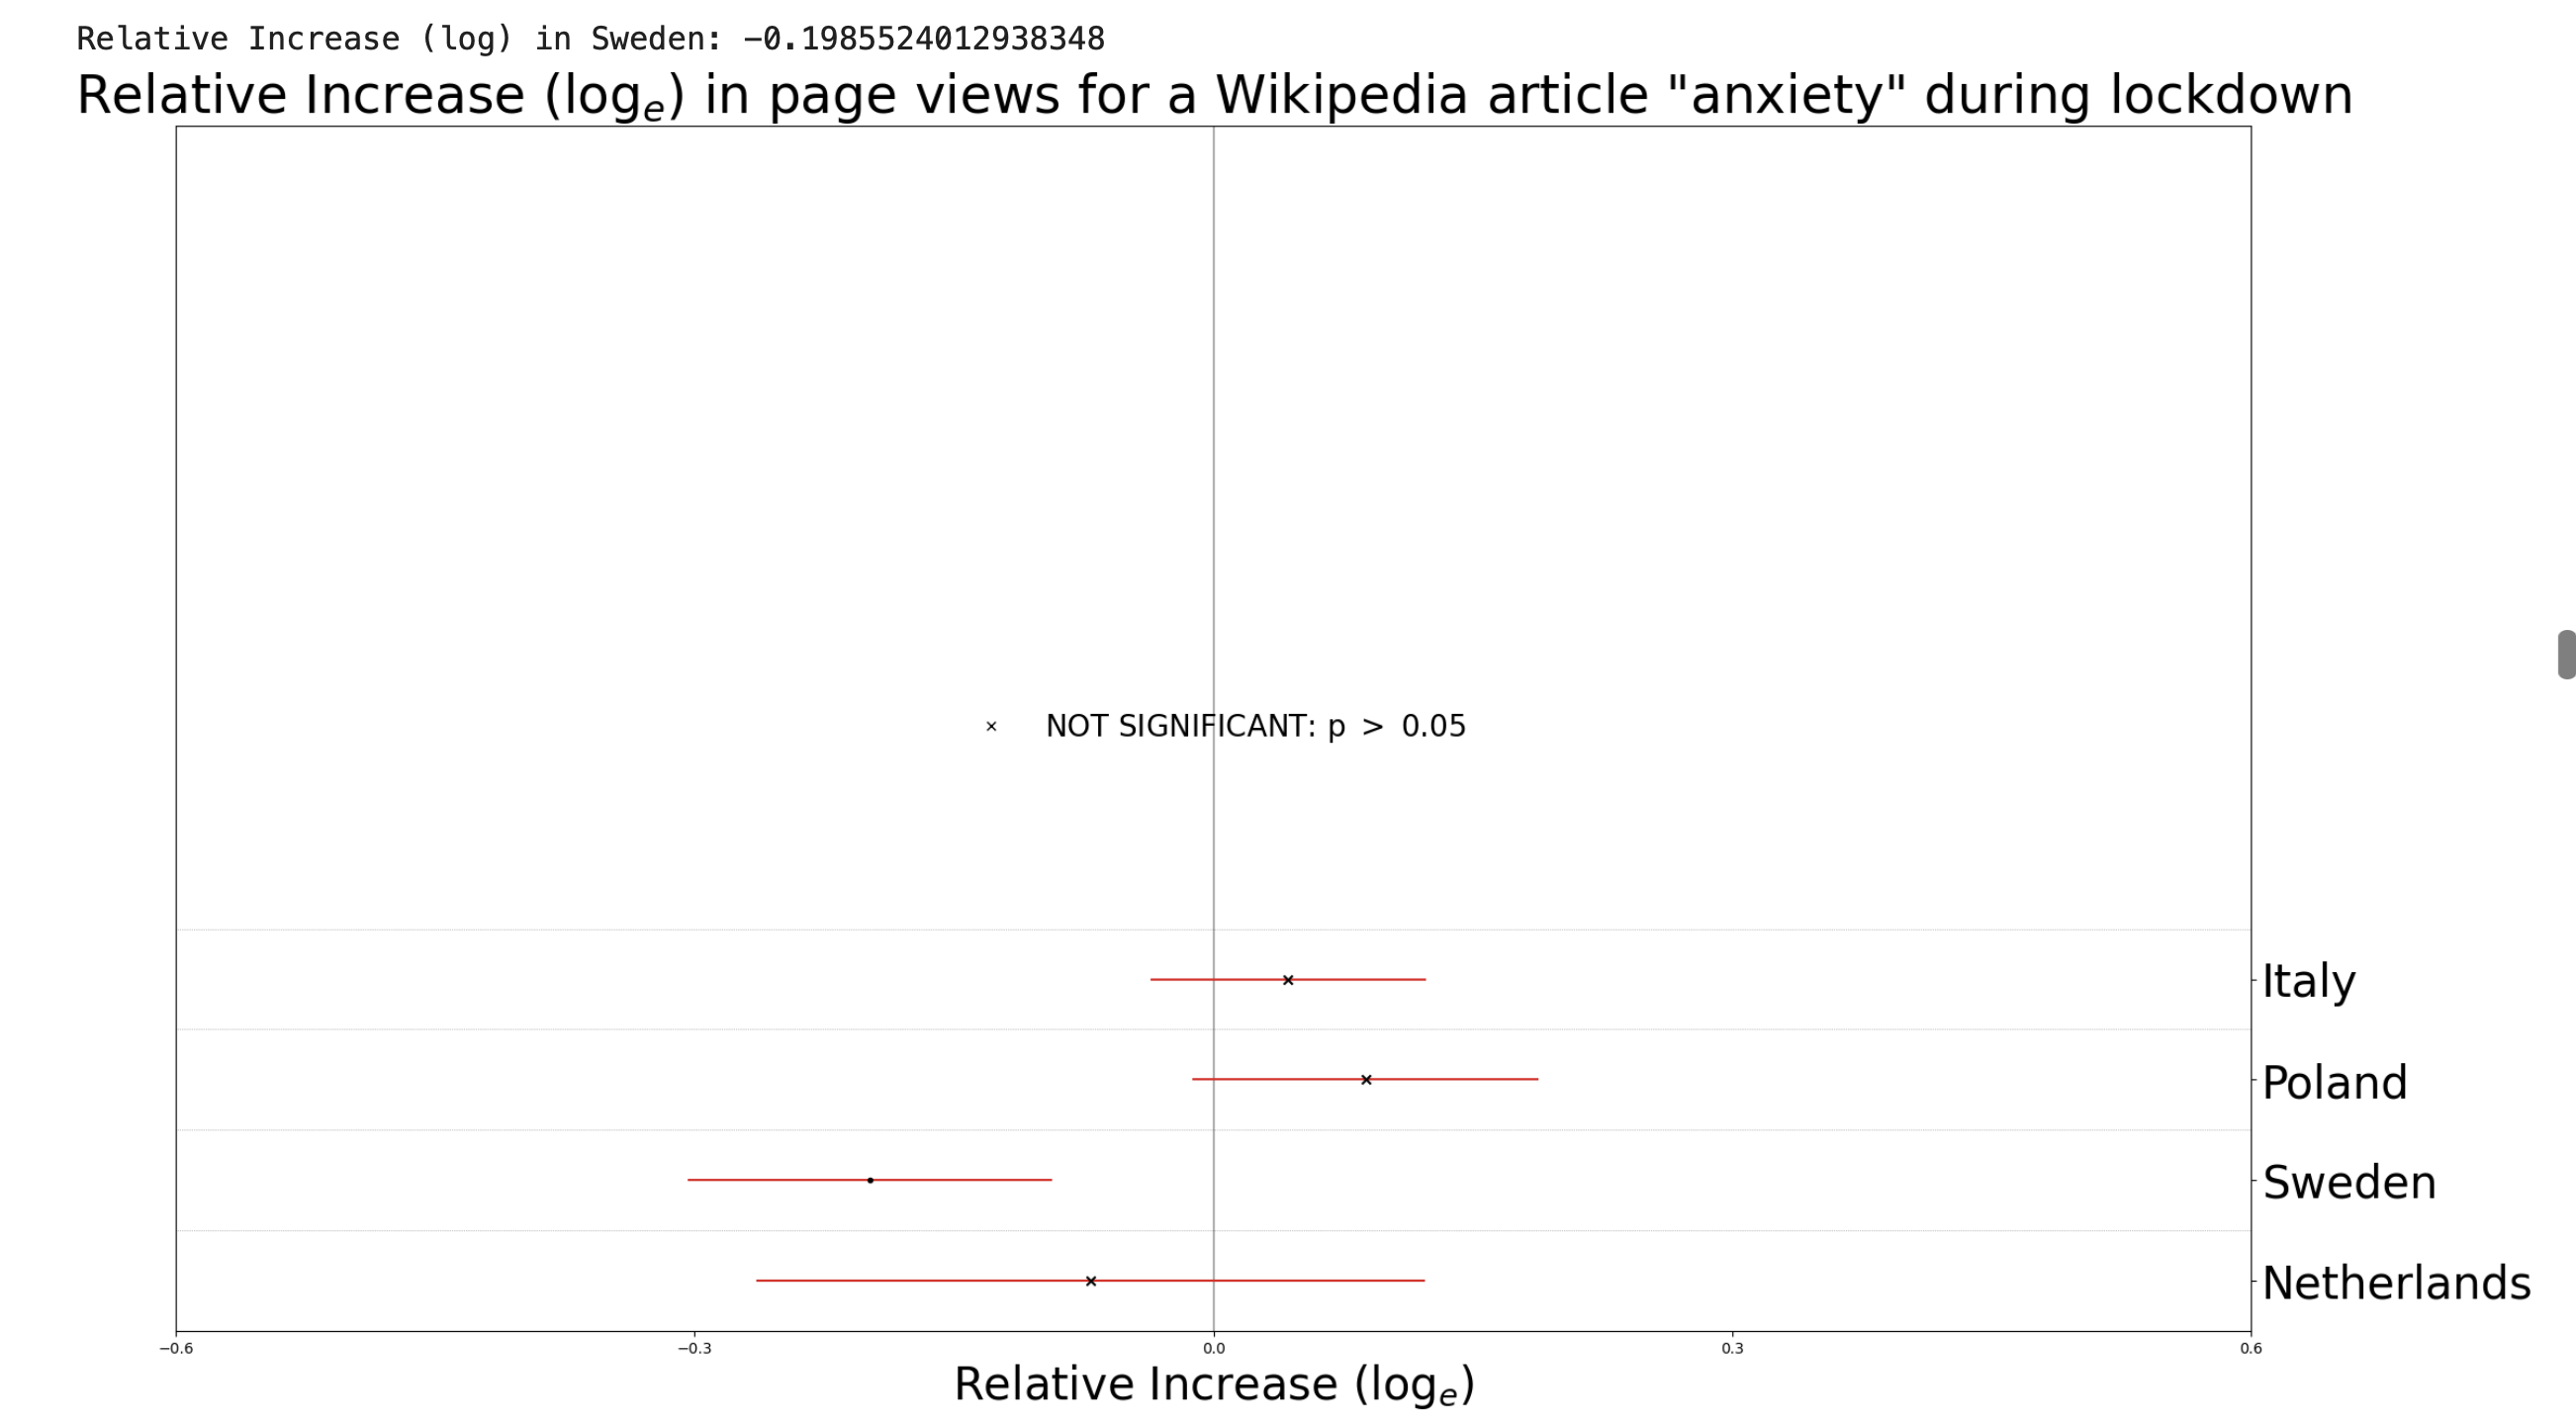
In the diagram above, we have plotted the estimated logarithmic effects of lockdown on the volume of pageviews for a Wikipedia article "anxiety" for each country. We can see that the logarithmic pre-vs.-post lockdown effect on Sweden is around -0.2 (corresponding to a decrease in pageviews to exp(-0.2) ≈ 81%). For other countries, we see insignificant effects. This is quite expected, since during the lockdown people did not go to work, school, or university, but stayed at home, so there were few reasons for anxiety, accordingly, less or equal interest in an article about anxiety. To visually observe the effect, we have plotted the page views of the article "anxiety" in Swedish for a period of 7 weeks before lockdown and 7 weeks during lockdown.
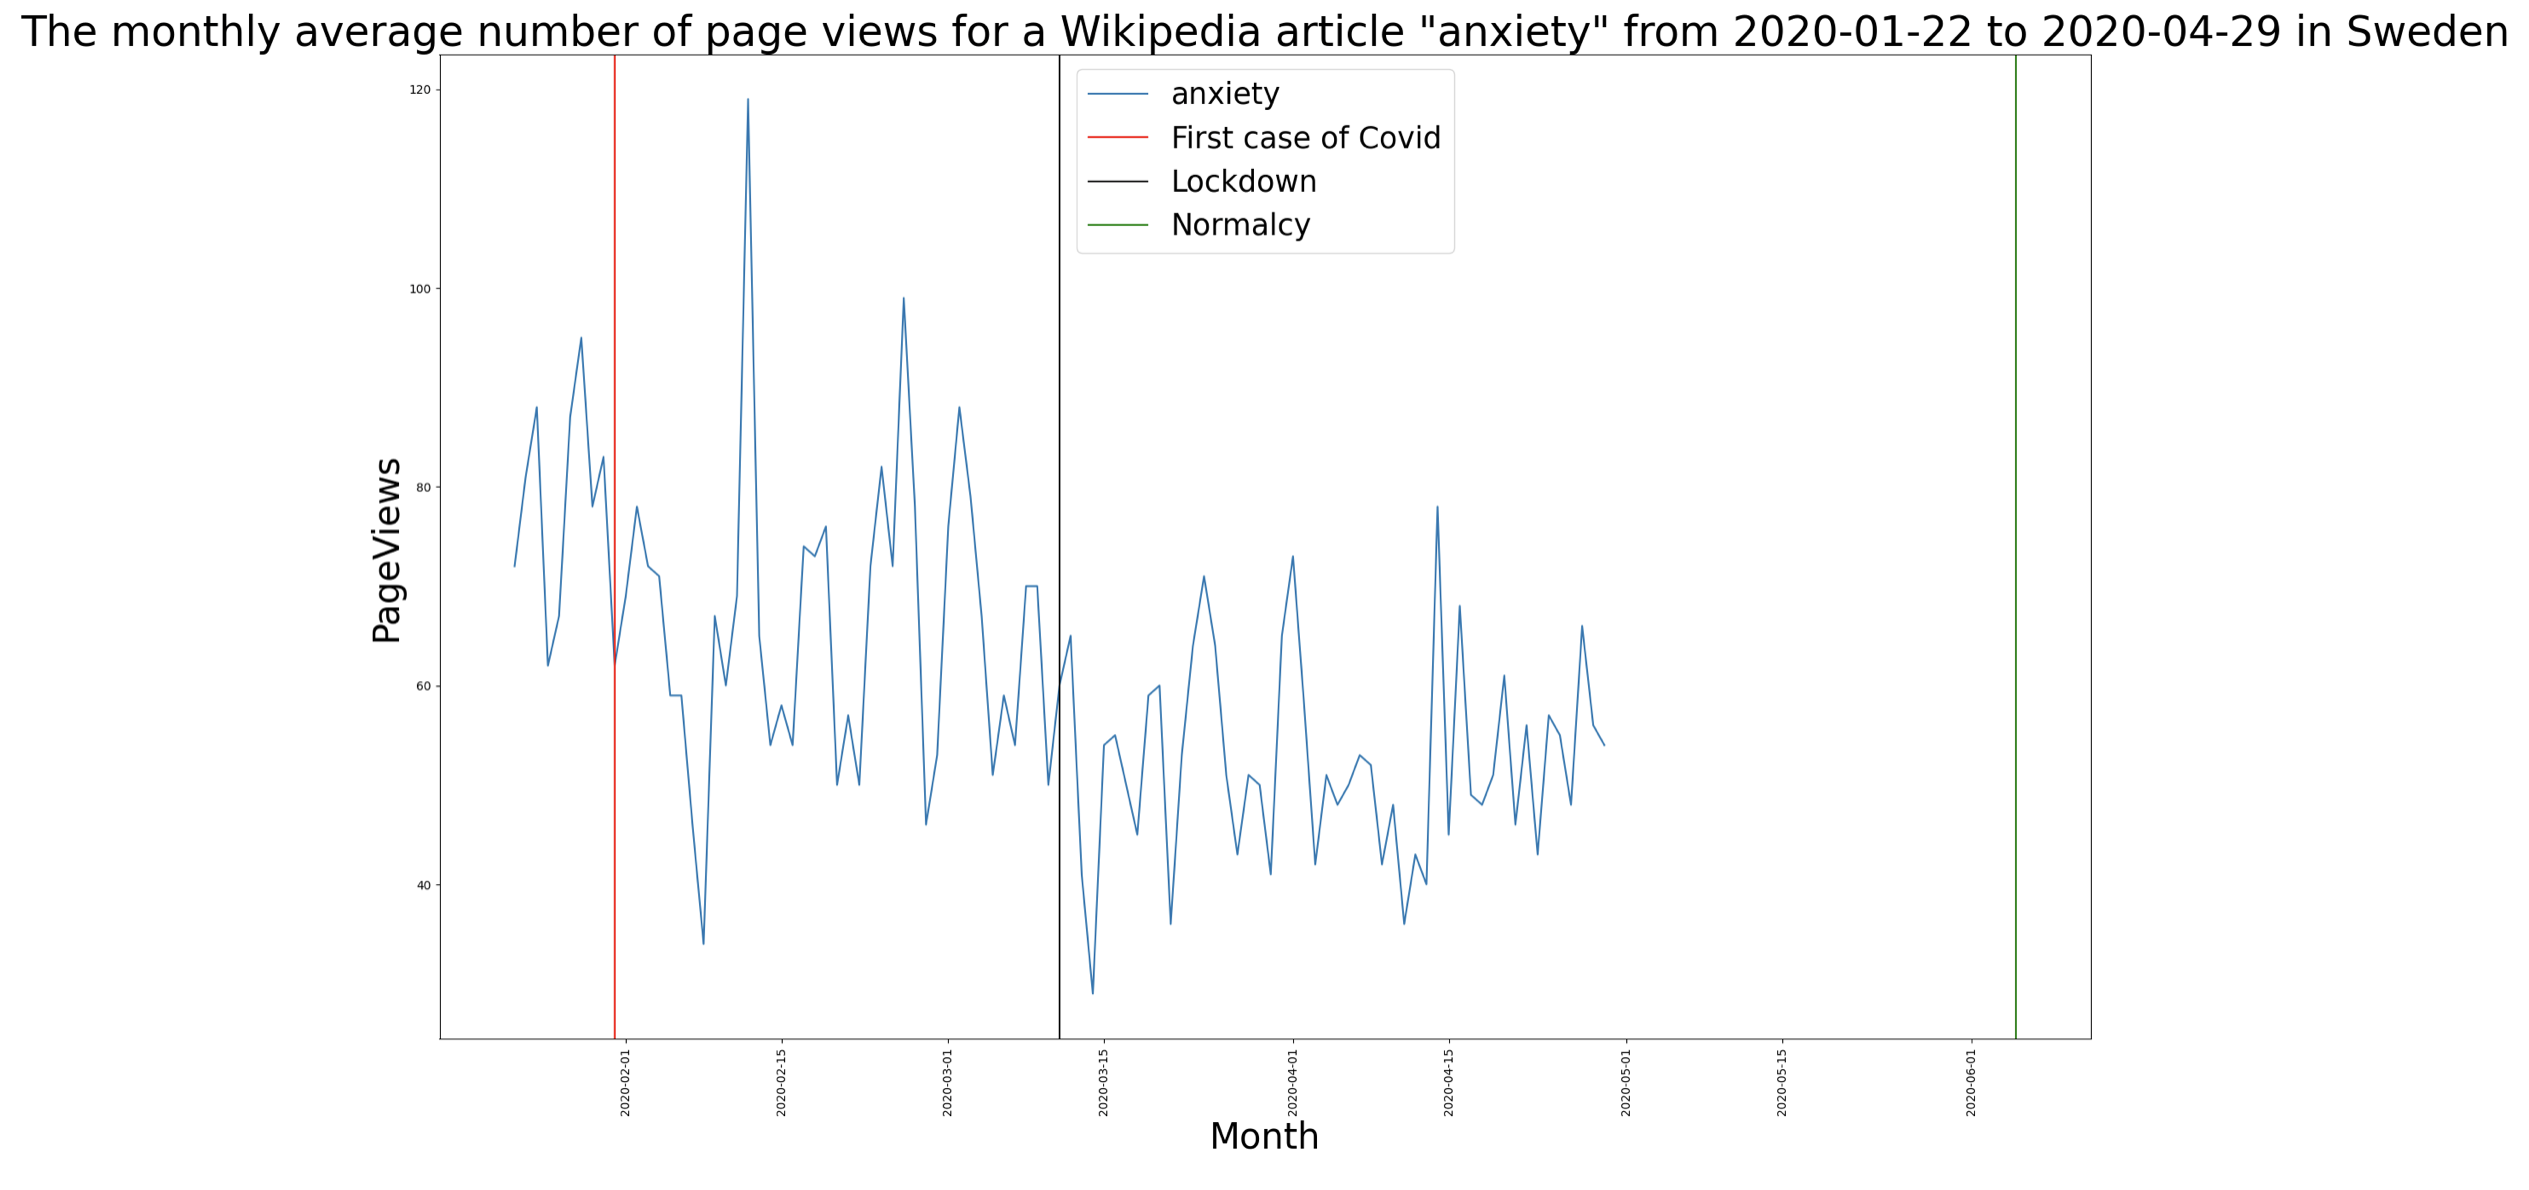
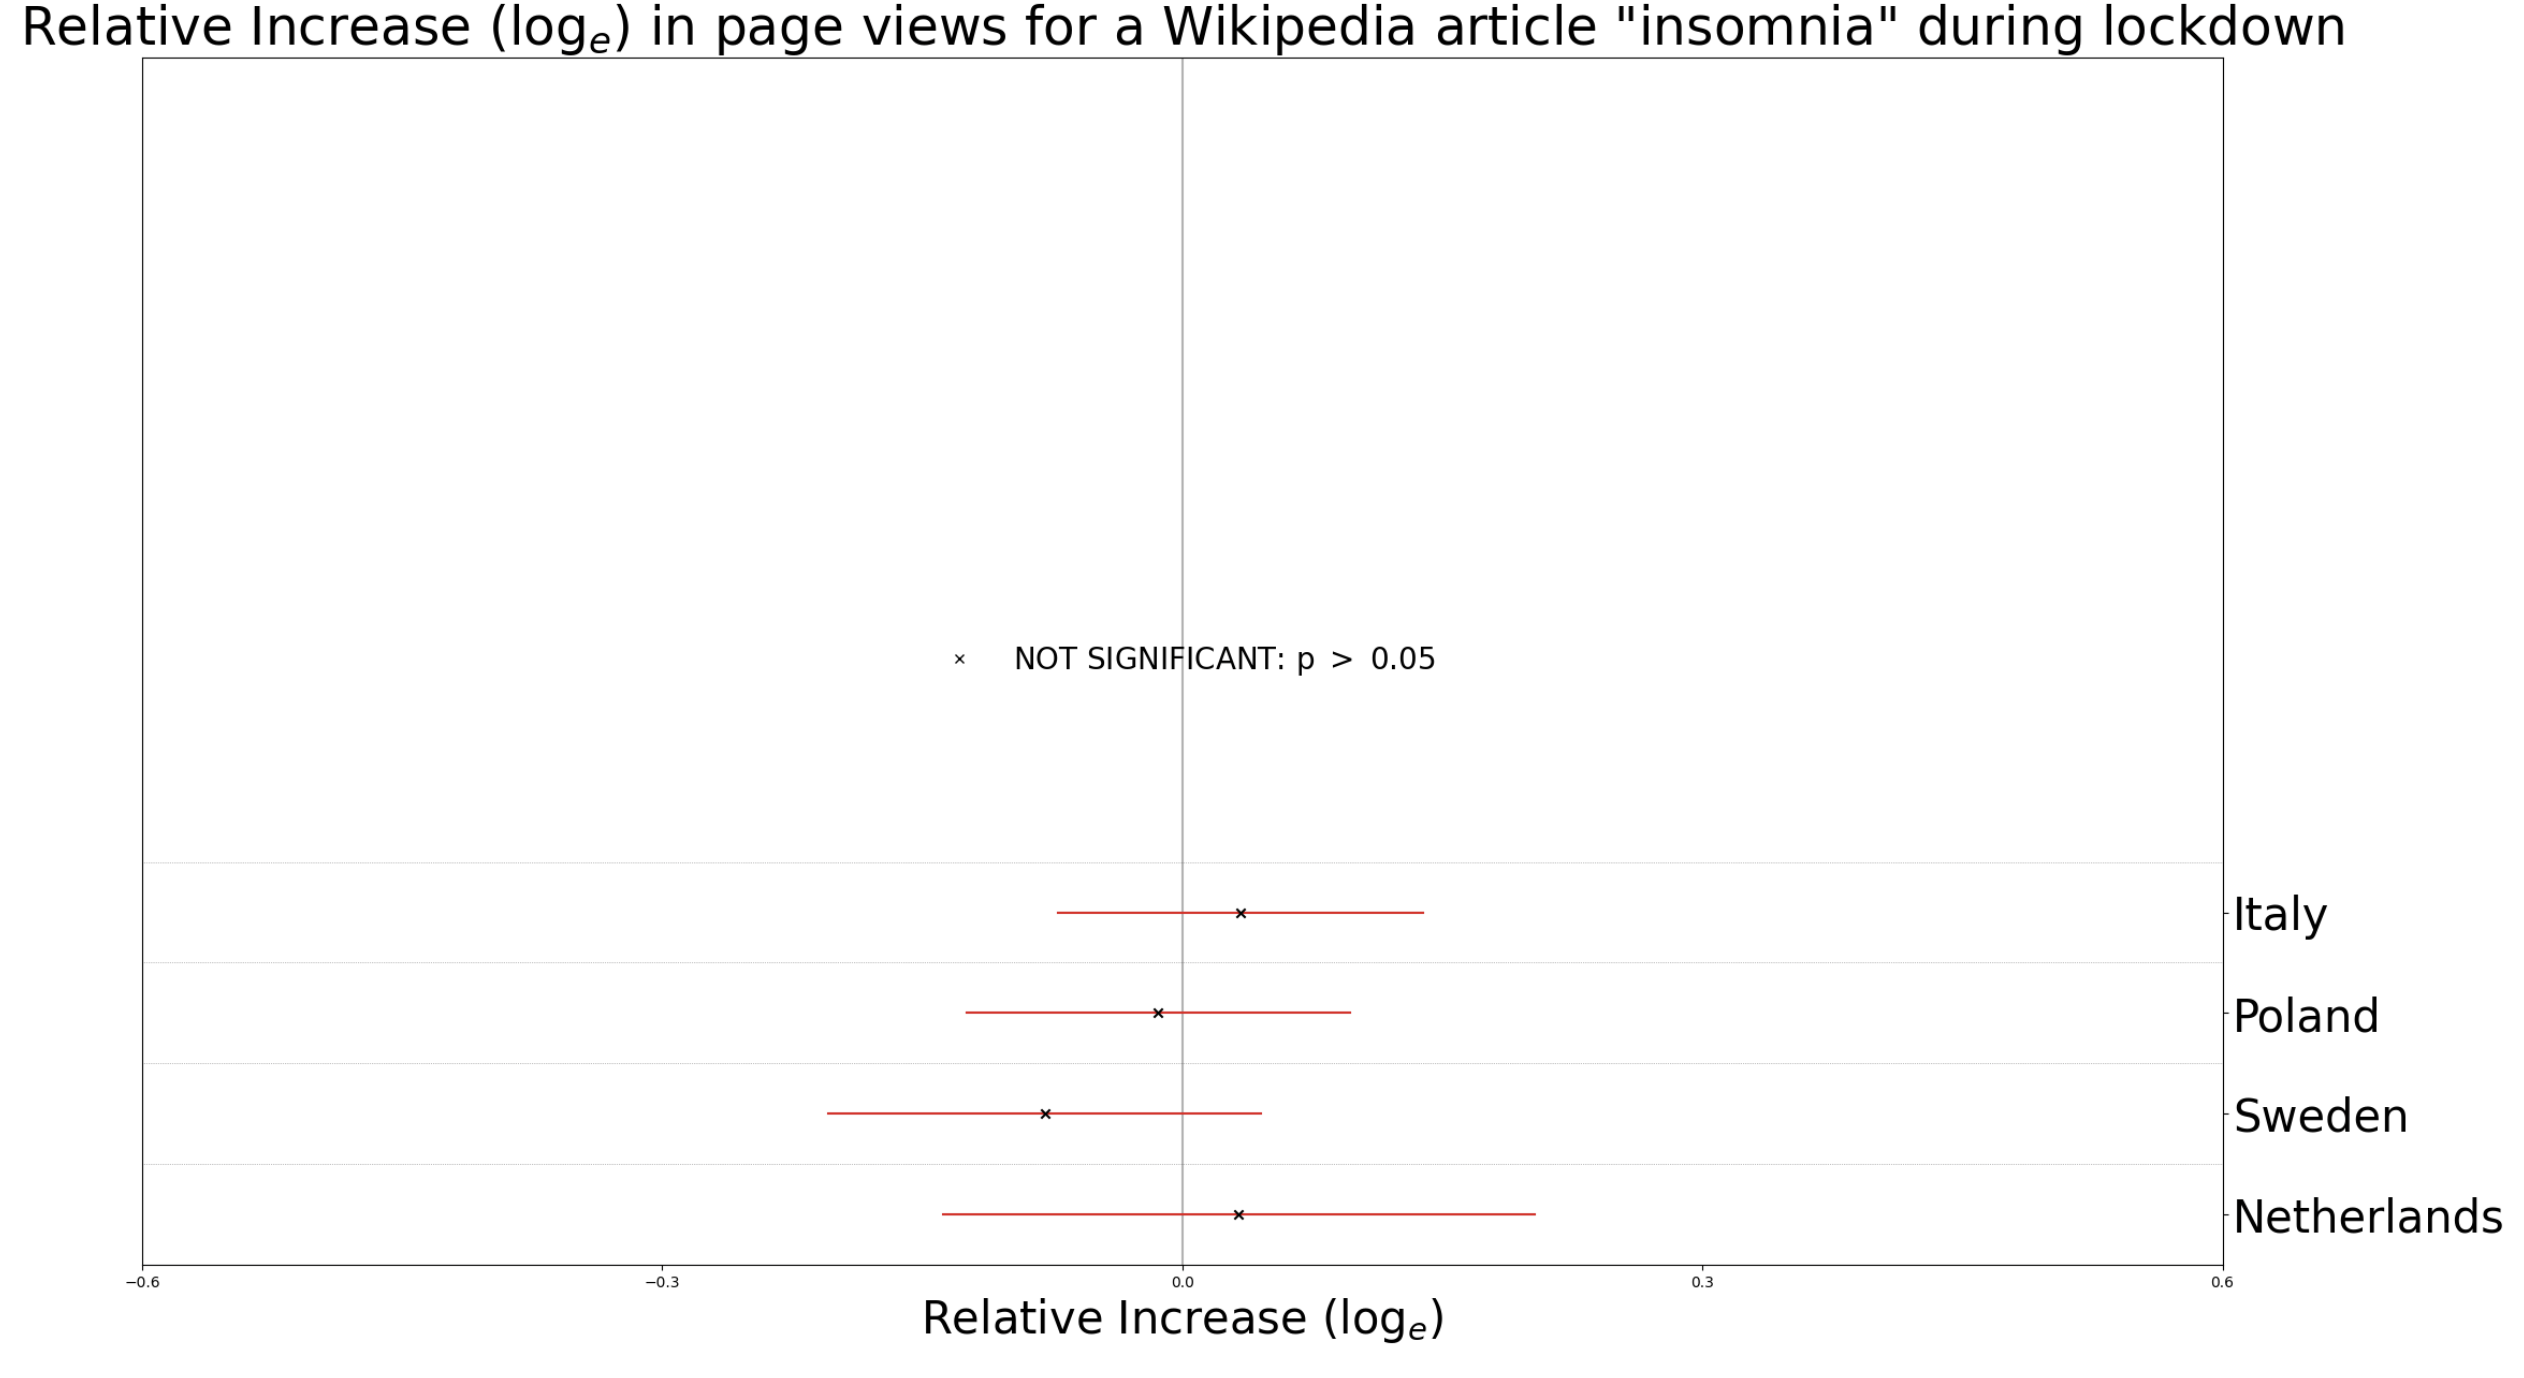
We can see that, indeed, during the lockdown, the number of views of the article "anxiety" in Swedish decreased. For insomnia, we found that the effect of lockdown on page views was negligible:
For loneliness we got quite interesting results:
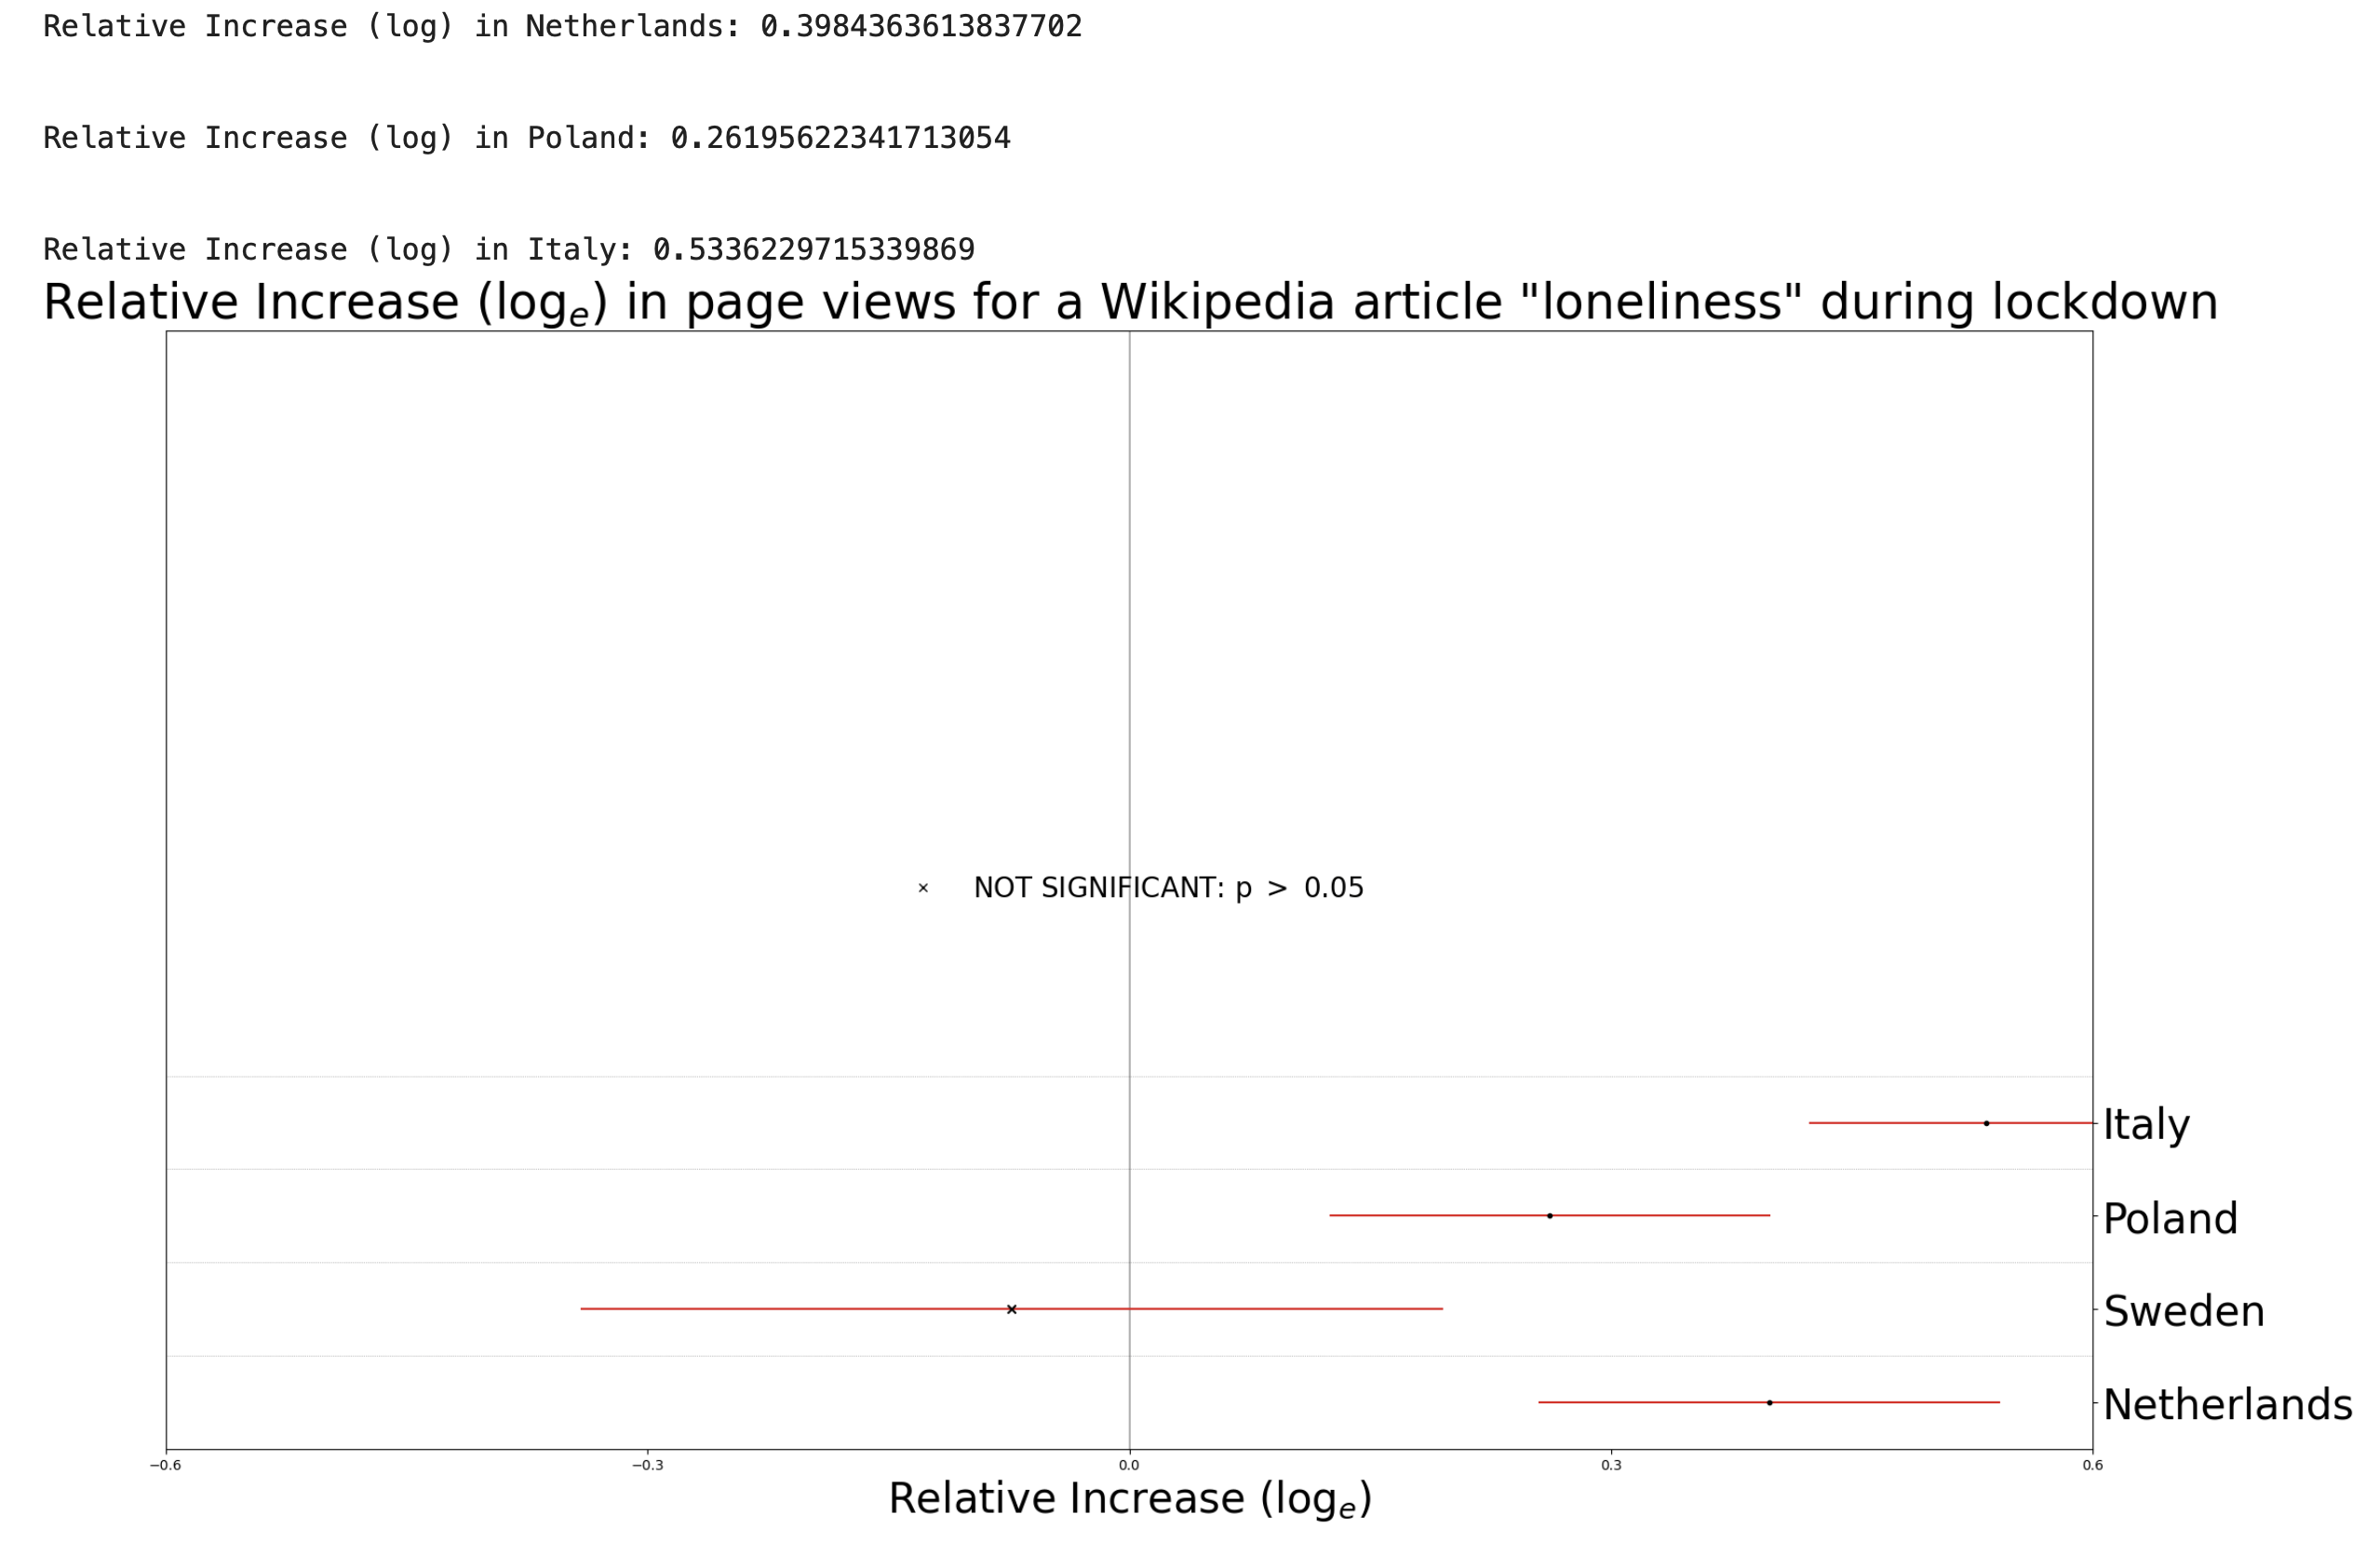
Here we can see that the logarithmic pre-vs.-post lockdown effect on the Netherlands version is around 0.4 (corresponding to a increase in pageviews to exp(0.4) ≈ 149%), and on the Poland version is around 0.26 (corresponding to a increase in pageviews to exp(0.26) ≈ 129%) and on the Italy version is around 0.53 (corresponding to a increase in pageviews to exp(0.53) ≈ 169%). For Sweden the effect is insignificant. This increase in page views can be explained by the fact that during the quarantine, a significant number of people stayed at home alone, and since the quarantine lasted for a long time, they began to feel lonely. Let's see the plot of pageviews of the article loneliness in Dutch, Polish, and Italian languages.
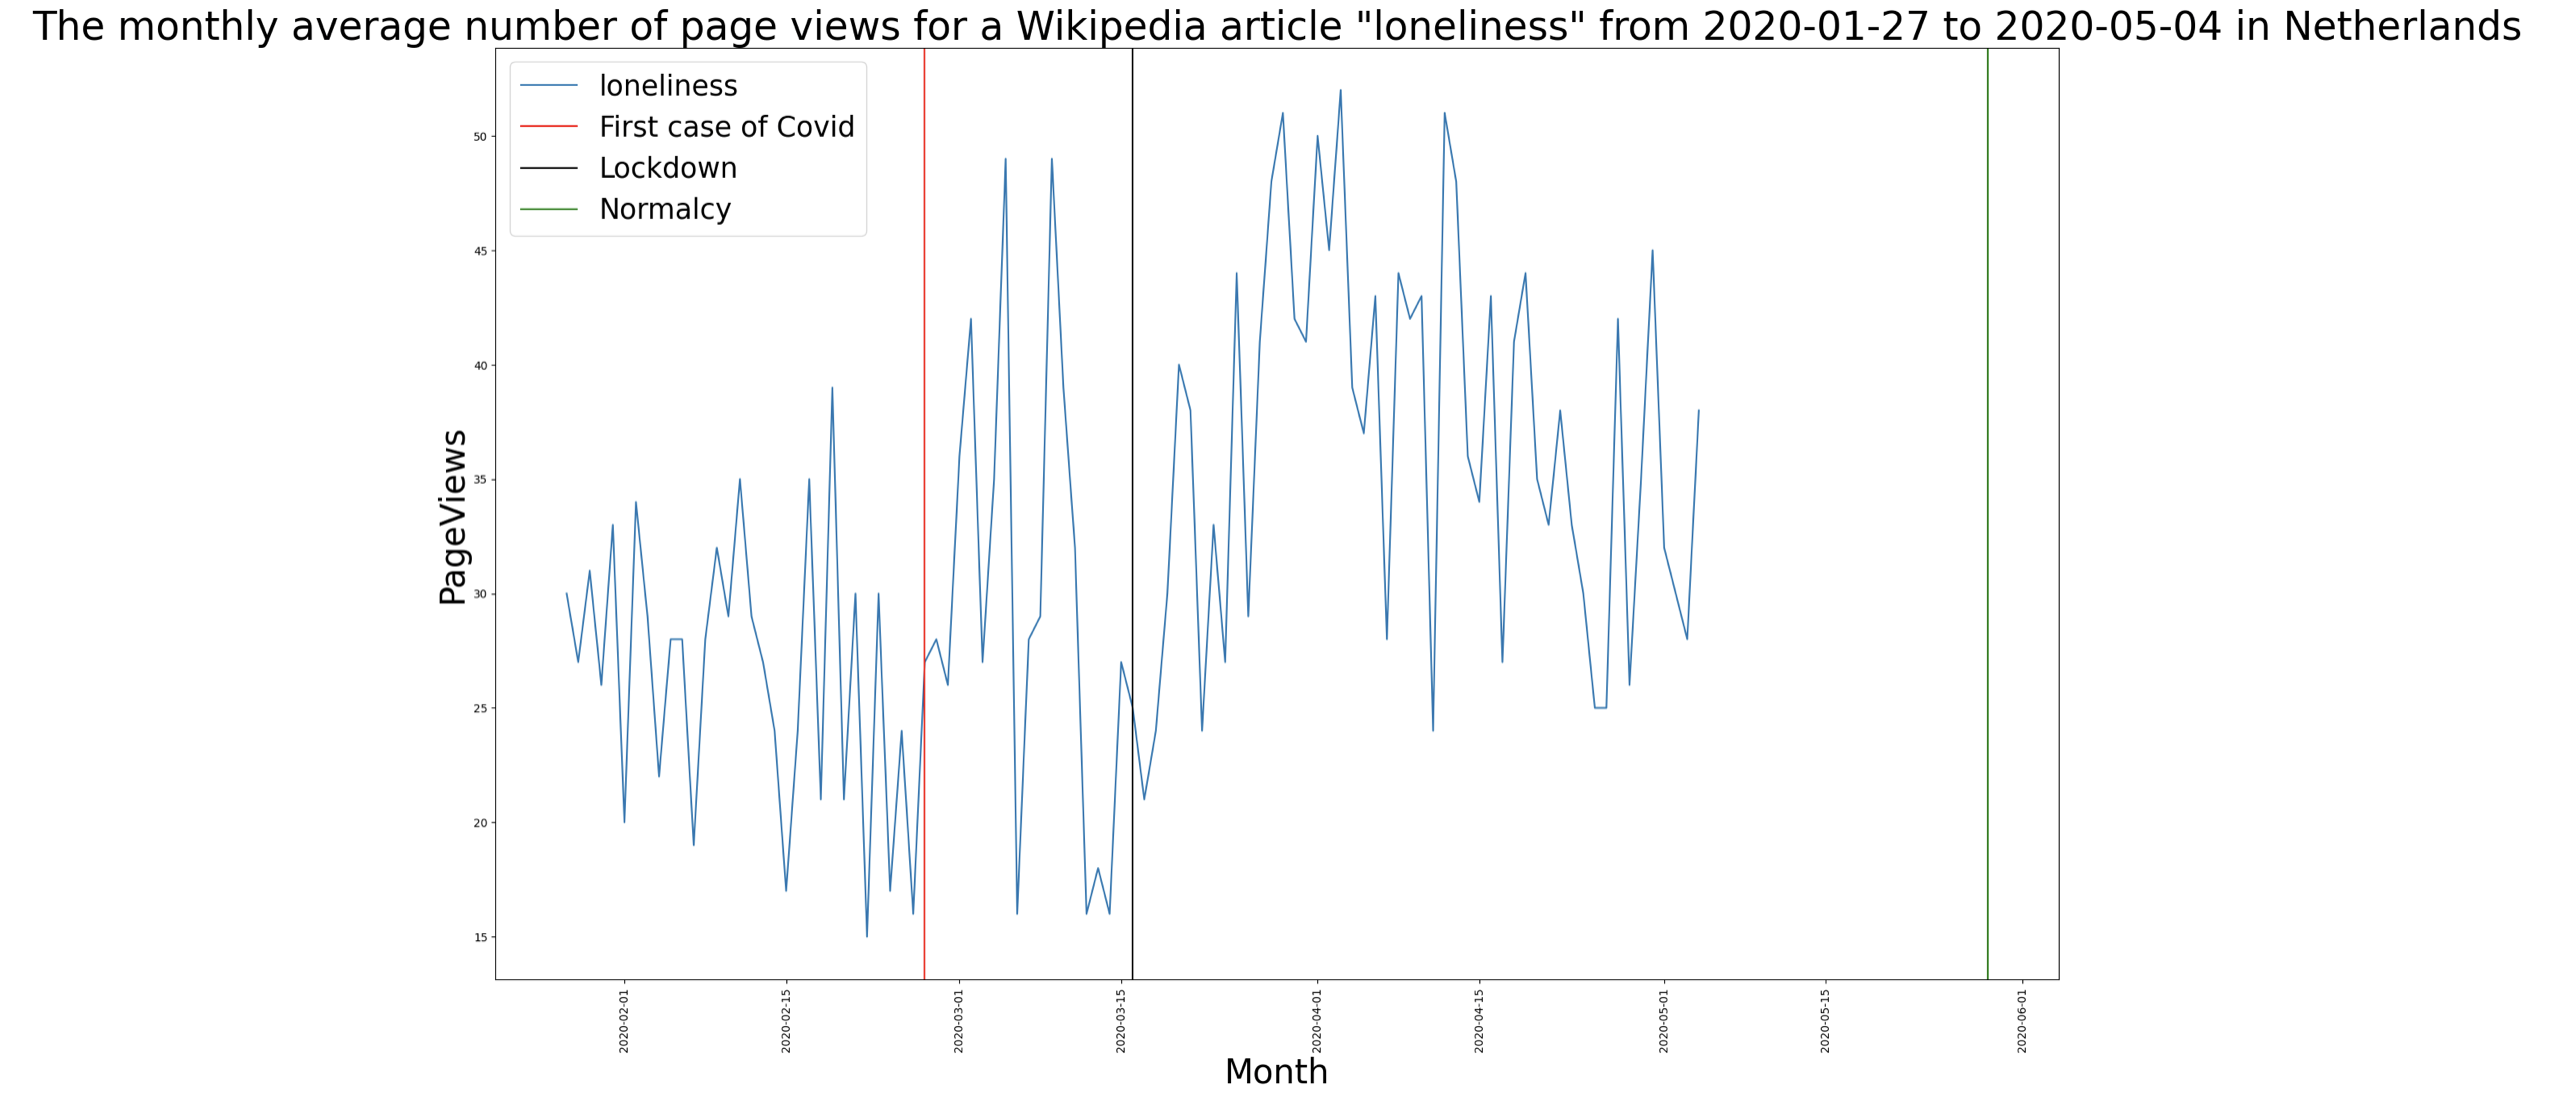
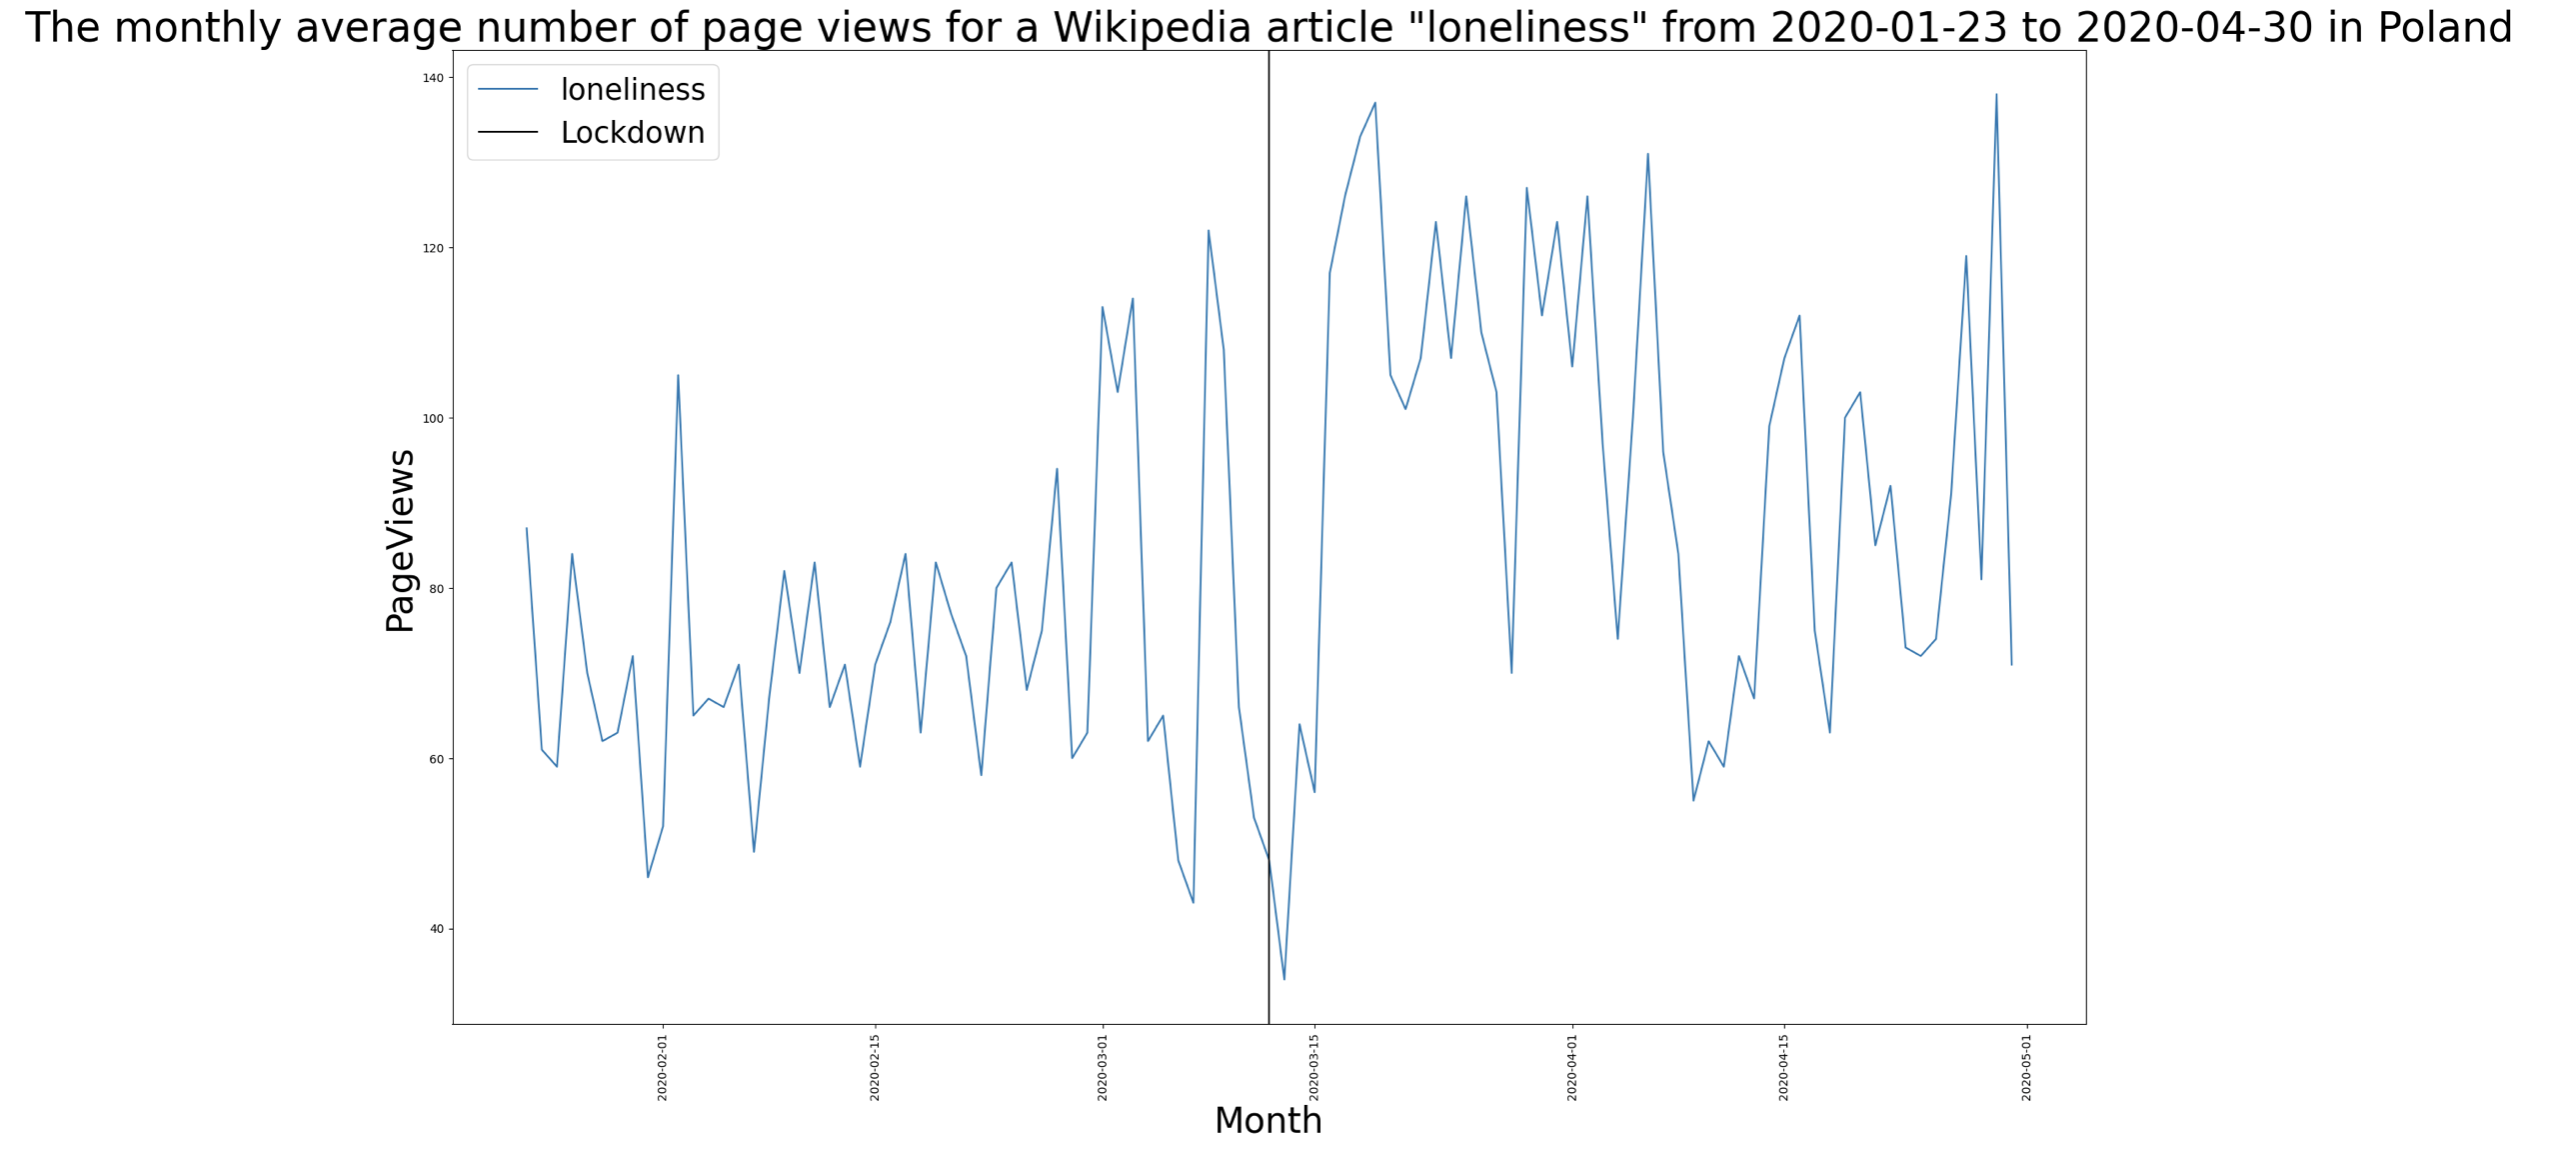
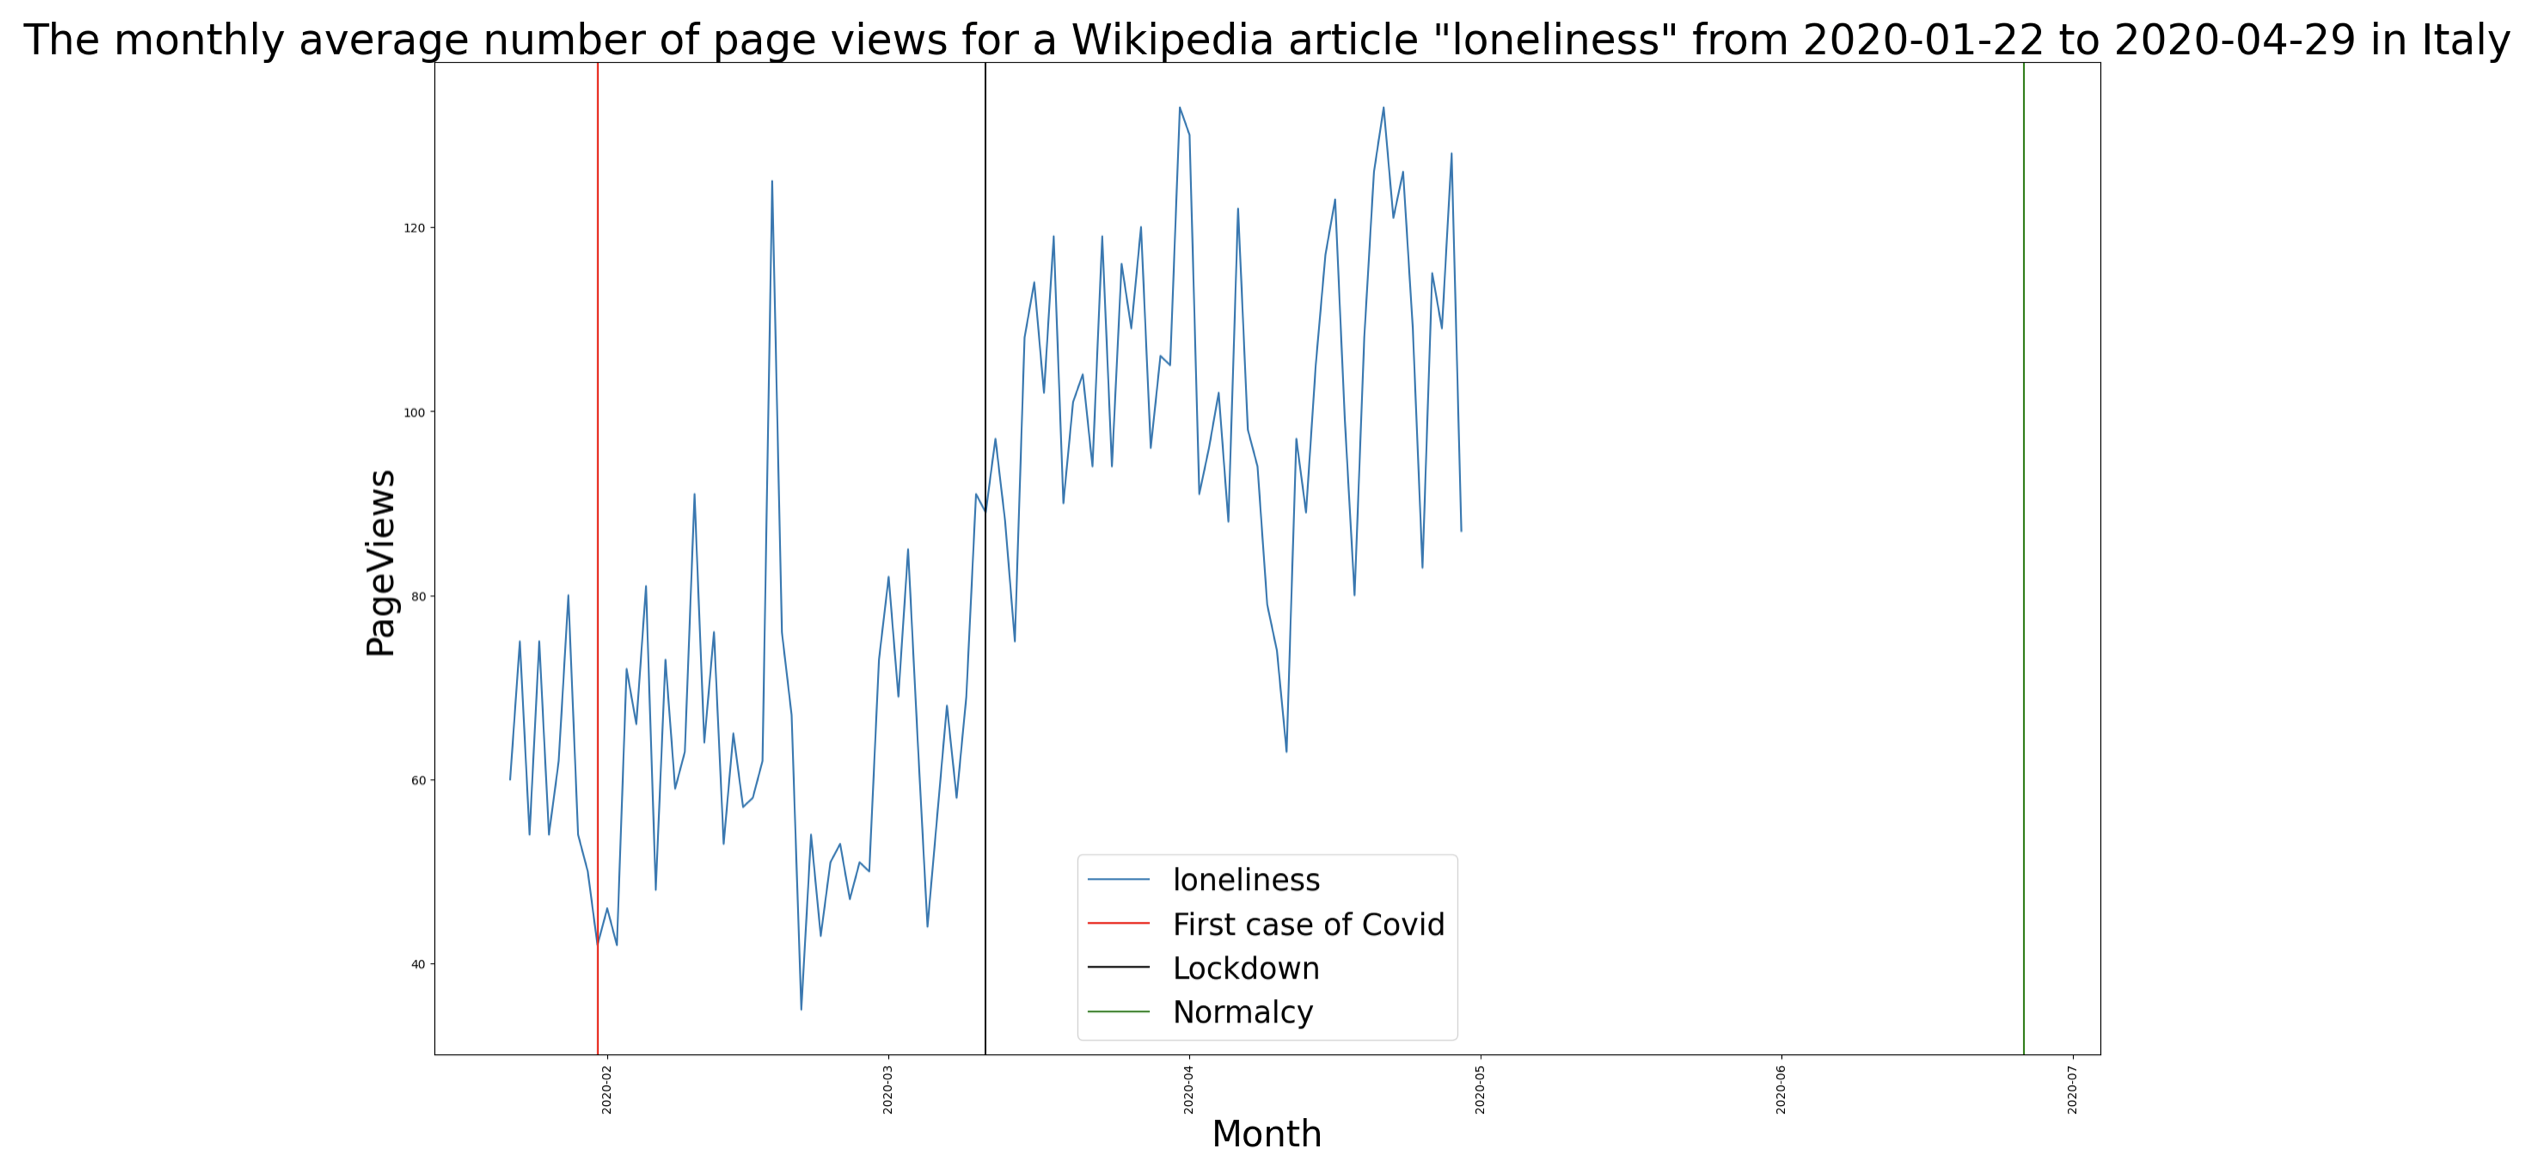
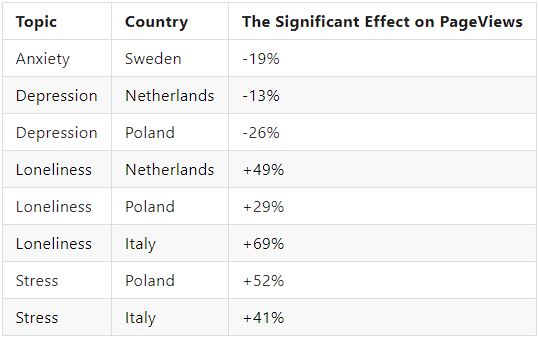
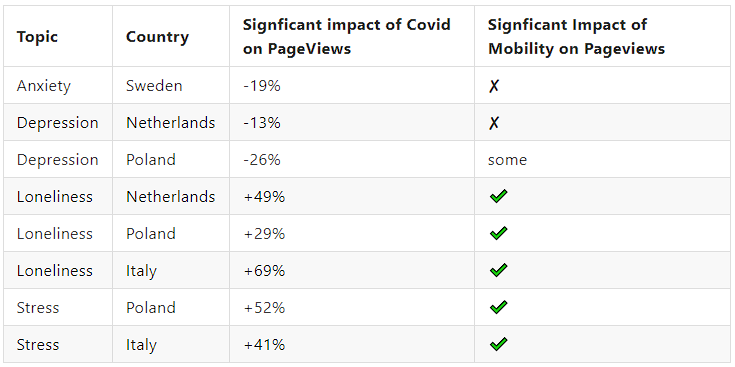
The effect of lockdown due to COVID-19 on page views is visible for all countries. We performed the same analysis for "depression" and "stress", the results can be found in the table below. In summary, our findings suggest that the sharp decrease in human mobility induced by the COVID-19 lockdown has changed the information-seeking pattern on Wikipedia pages related to mental health. For topics such as "Anxiety" and "Depression", the volume of page views surprisingly decreased significantly, while for "Insomnia" the volume doesn't change. For 'Loneliness" and "Stress" page views increased significantly. Table of all results:
Having shown the significant impact of lockdowns on Wikipedia pageviews for certain disease/country combinations, we shall examine why lockdown have such effect. Could have the change in pageviews be caused by decrease in mobility?
Does mobility affect Wikipedia pageviews?
To assess the effect of reduced mobility on Wikipedia pageviews we employed regression analysis.
For every country and mental health issue we defined a linear regression model, which aims to predict Wikipedia pageviews of the mental health issue in the given country. As the only independent feature we used percent change in mobility of the given country for the given day. We decided to include data for the period slightly before lockdowns and a month or so post-lockdows's(i.e data over the period from 13 March till 31 August). In total we have 20 models and plots - 1 for each country/mental-health pair.
Results
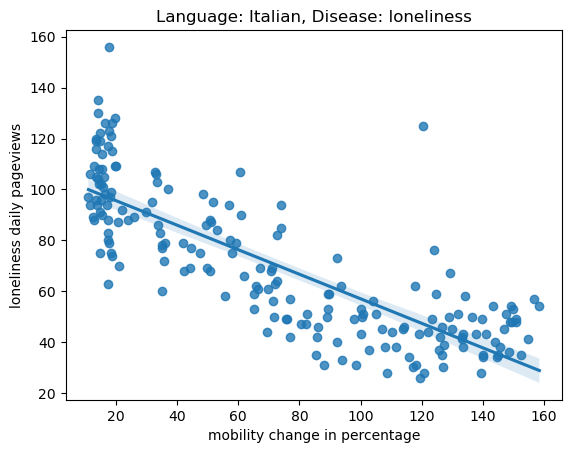
Previously we found that the highest significant effect on pageviews is for the case of loneliness in Italy. Now, let us use ouor model for this case. We found that mobility has a significant effect on loneliness pageviews in Italy. With Adjusted R squared value of 0.66, the model explains the variance in data very well, see the figure below. Hence, we conclude that mobility has a high correlation on loneliness in Italy. This is coherent with the results obtained from the difference-in-difference regression, where we found a significant effect of lockdown on changes in pageviews for loneliness in Italy. In addition to that, the regression model allows us to say that the reason behind lockdowns having significant effect is the change in mobility.
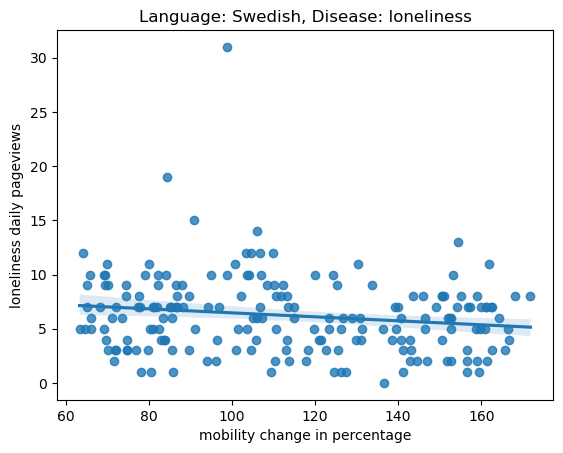
However, not all our models explain the pageviews just as well. Consider anxiety in Sweden, in this case our model has a low adjusted R-Squared value. This would not be problem if this was our only model and we would not know how large adjusted R-Squared value we should expect. However, this adjusted R-Squared value is much smaller than another adjusted R-Squared value in the same domain - in model for loneliness in Ialy. Thus we conclude that mobility did not have a signifact effect on pagaviews, despite finding a significant effect of lockdown in pageviews change with the difference-in-difference regression. There must have been some other lockdown-induced factor that contributed to this effect. Indeed the following plot shows less correlation between mobility and pageviews compared to the previous plot.
Summary
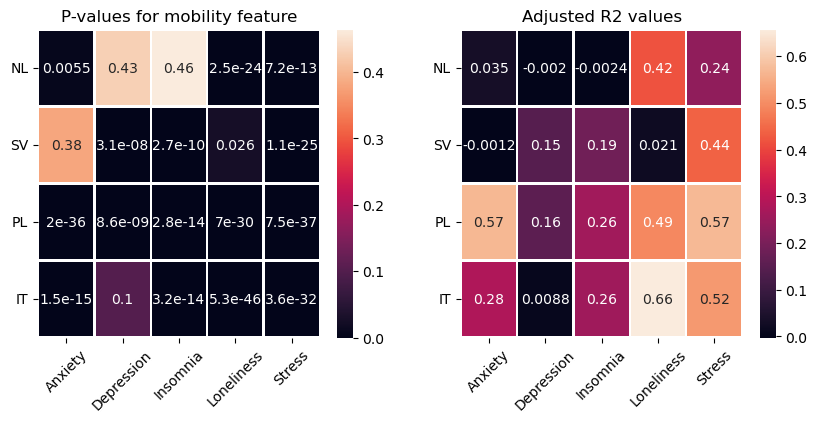
Below you can find a summary of the p-values and Ajusted R-squared values for each of our models.
What does this mean?
Overall, in 16 out of 20 models we found significant p-values for the effect of mobility on the number of pageviews, thus showing evidence of correlation between mobility and wikipedia pageviews for our mental health topics. On the other hand for many models the low R-squared values show that for some models there remains a high amount of unexplained variance.
The model fits the best for stress and loneliness (except for Sweden). These Sweden exception is not suprising to us as we expected a difference in Sweden compared to other countries, given they had not implemented a lockdown like the other countries we considered, however, we also expected to find more significant results for anxiety and depression.
Mixing our results with those of the difference-in-difference anaylsis we get this new updated table below. Notice that each time covid lockdown has positive effects on pageviews, then there is a significant effect of mobility on pageviews too.
From Pageviews to Reality
We now know that mobility indeed has an effect on the Wikipedia pageviews for selected mental health issues. However does it really represent how people feel?, does an increase in wikipedia pageviews about stress, imply an increase in stress?
COVIDiSTRESS Dataset
We decided to look for a way to find out how people really felt during the initial lockdown. During exploratory phase, we stumbled upon an interesting dataset, COVIDiSTRESS . This dataset is a global survey on psychological and behavioral consequences of the COVID19 outbreak. With a total of 173 426 participants from 179 countries on six continents, it contains measurements on perceived stress and perceived loneliness on a likert scale from "never" felt it to "very often". This survey was conducted during the first lockdown. In total there are 3 survey dates - in April, May, and June.
Our data during the Covidistress survey period:
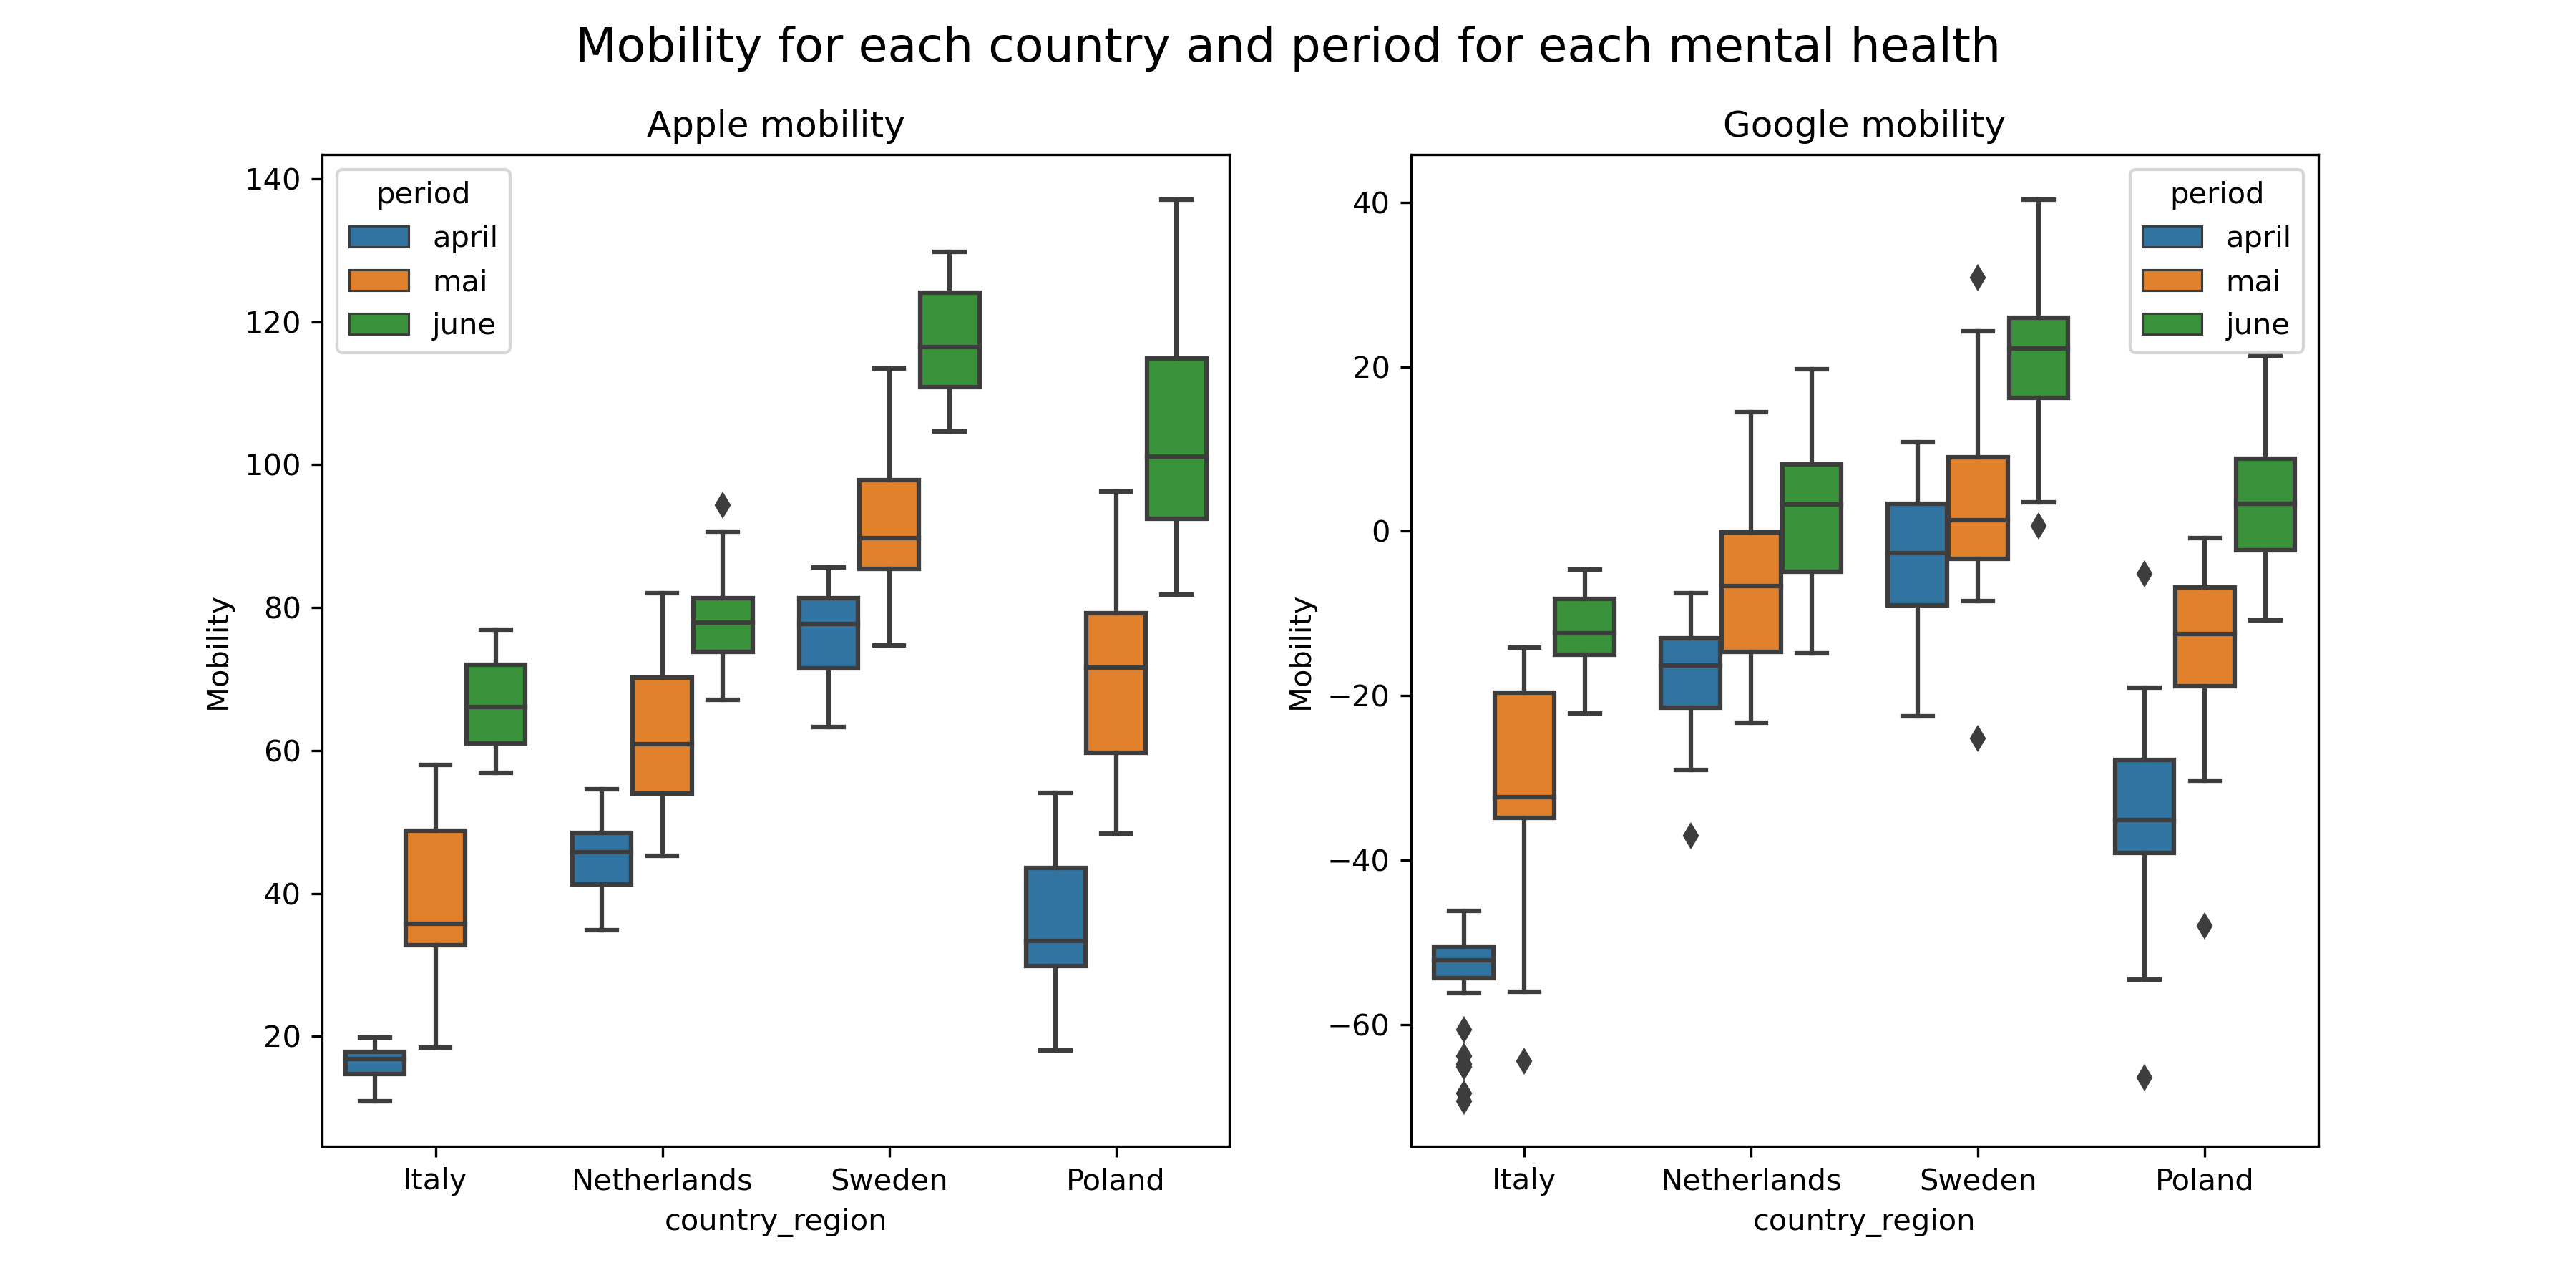
As seen earlier, the pageviews for loneliness and stress both have statistically significant changes after the initial lockdown. Now let us see if there is any change in pageviews and mobility evolved when we limit the timeframe on the Covidistress duration - April, May and June 2020. Below you can see distribution in pageviews per country per month, where the boxes represent inter-quantile regions.
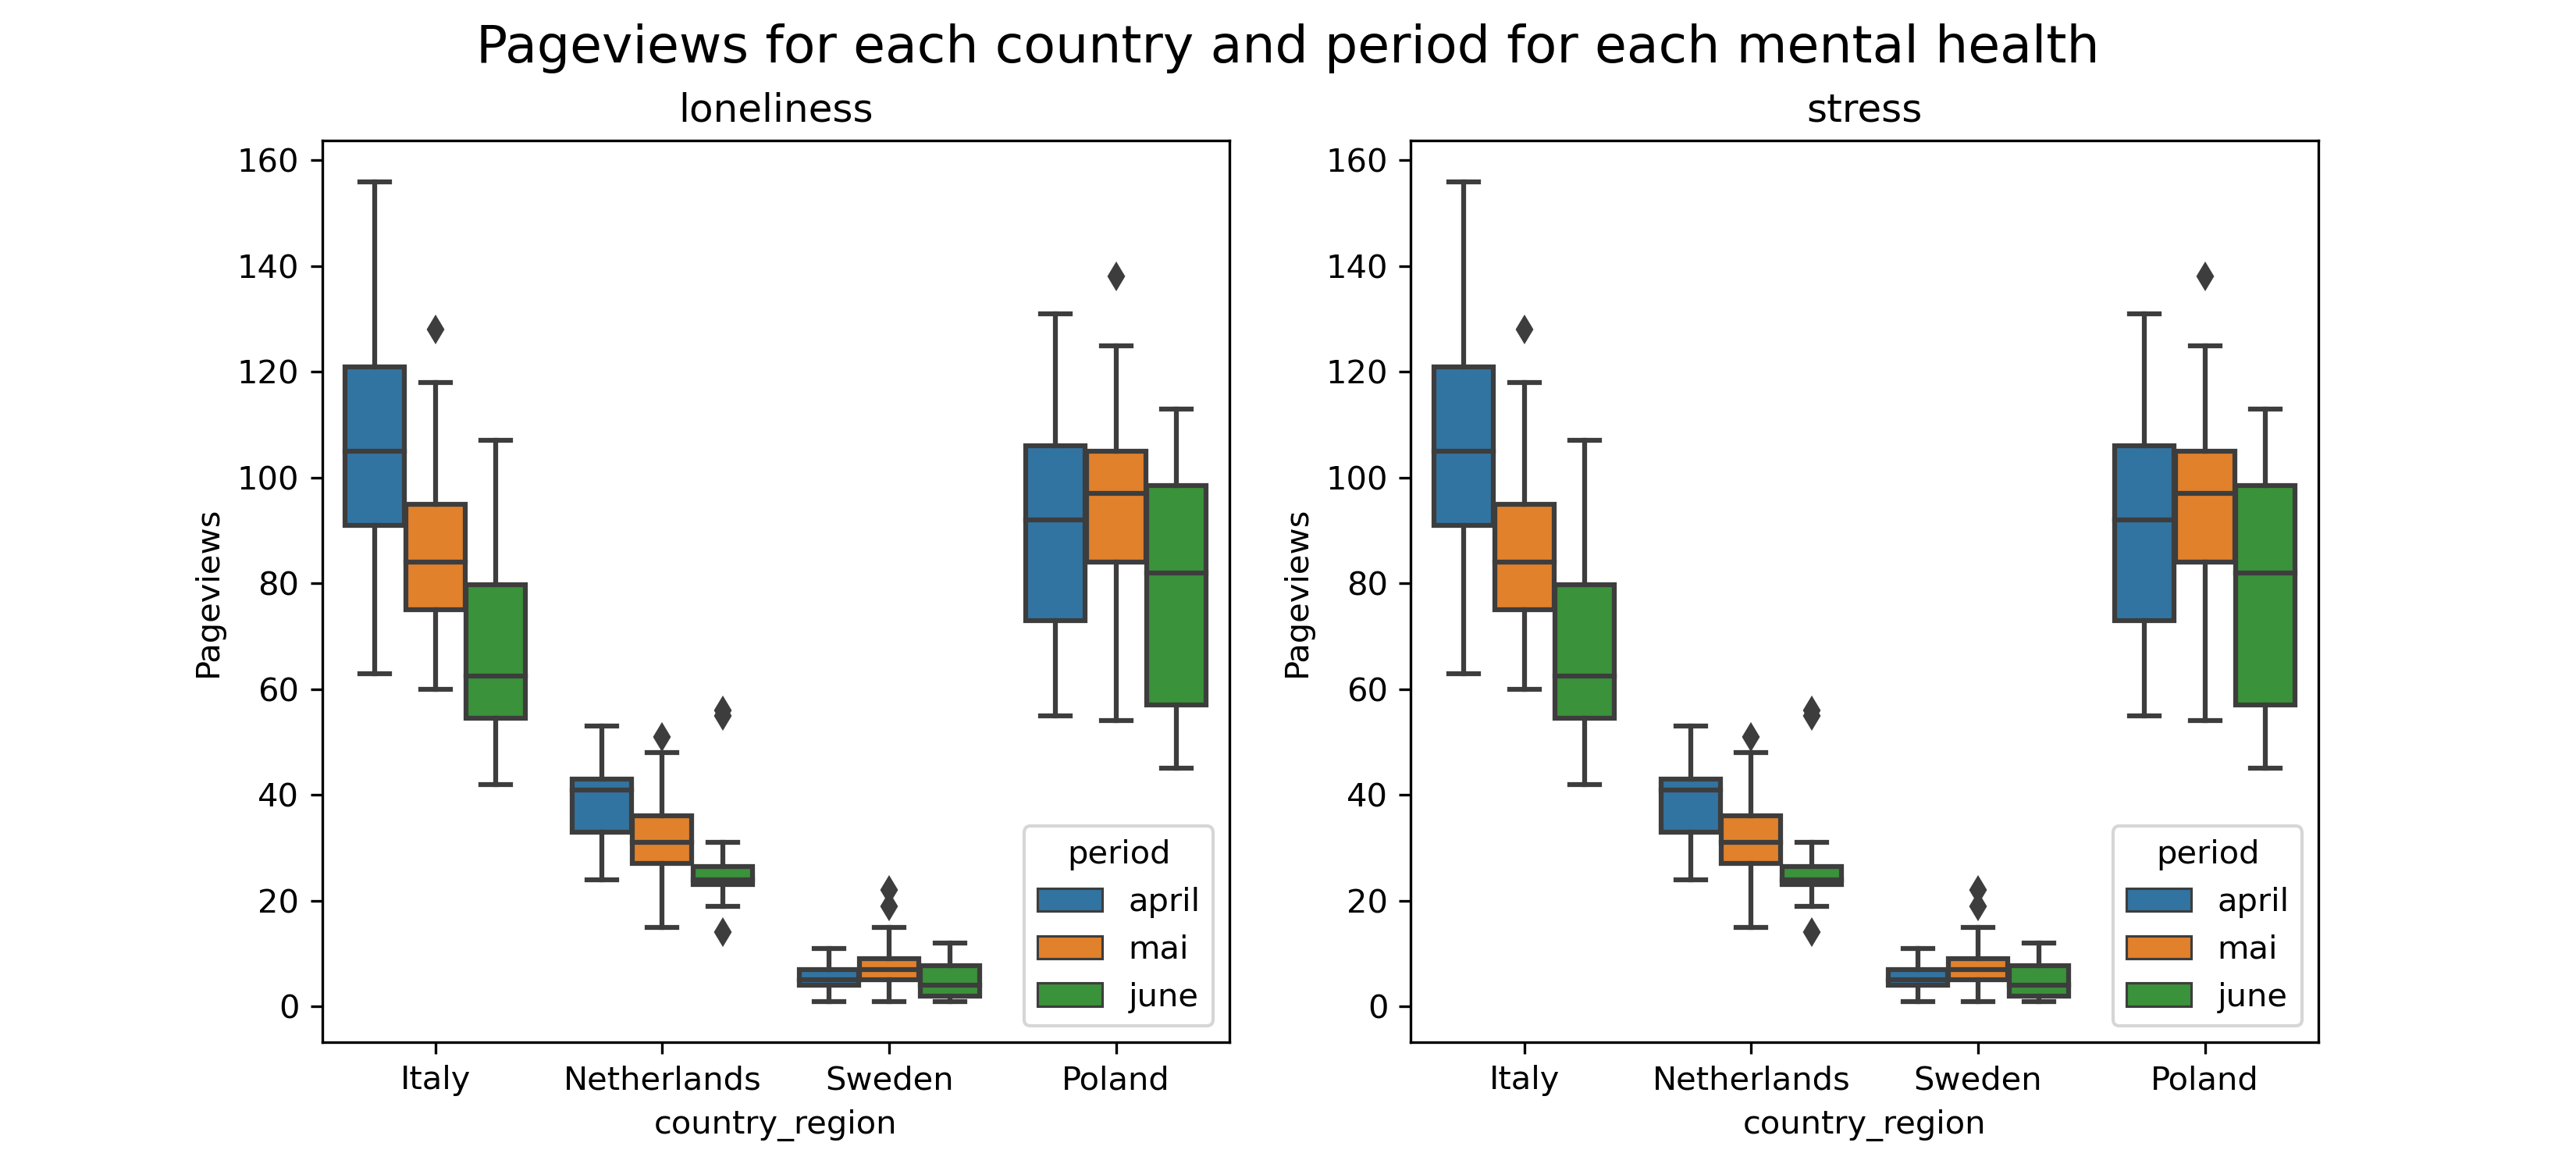
To examine if there is any change in pageviews in this reduced time period we used ANOVA. We found no significant change in pageviews during int this preiod. In detail, ANOVA test showed a difference, however after a Conover post hoc test it turned out that there was no real evidence of change.
Next we look at mobility during these 3 months. Below you can see distribution of mobility per country per month.
As expected, since in this time period the lockdown measures were already being lifted, we found a significant increase in mobility.
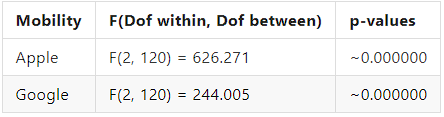
We have significant result in both time period and countries.
In addition, all post hoc Conover tests result showed a p-value under the Sidak correction.
Can we grasp the real effect of Covid on mental health using Covidistress?
After some pre-processing of Covidistress's data, we examined it in more detail and observed a rather normal distribution of the likert scale perception, for both stress and loneliness, see below.
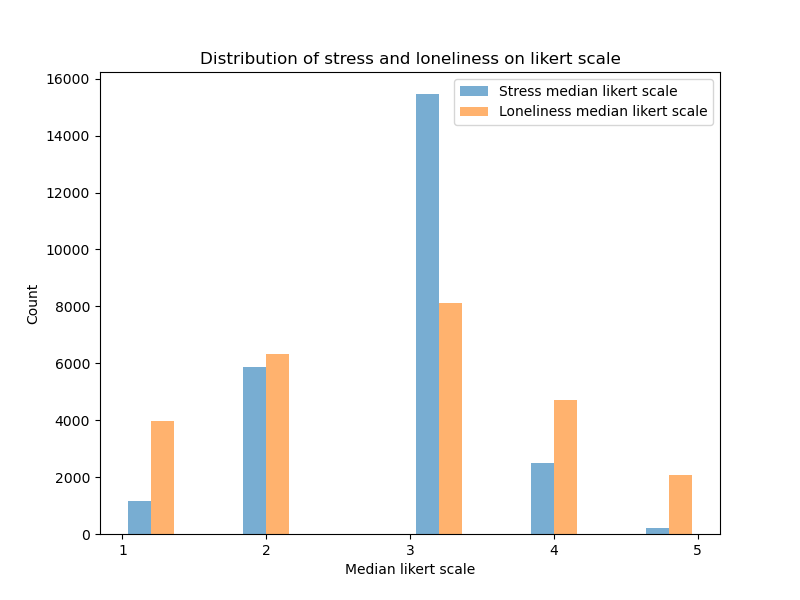
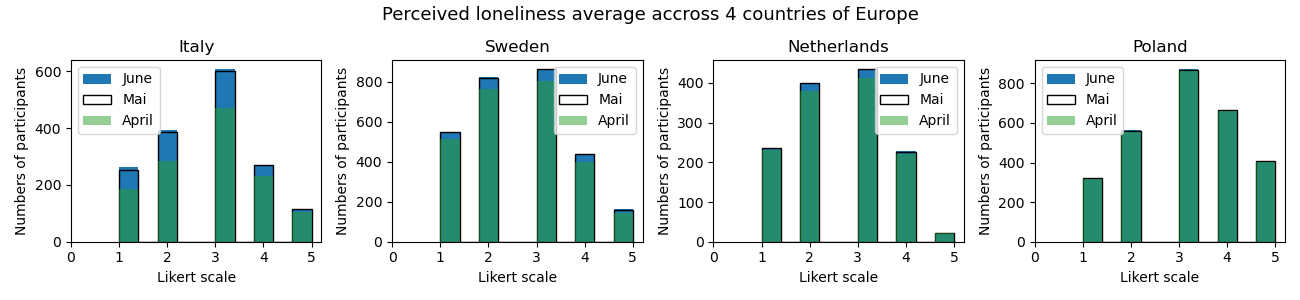
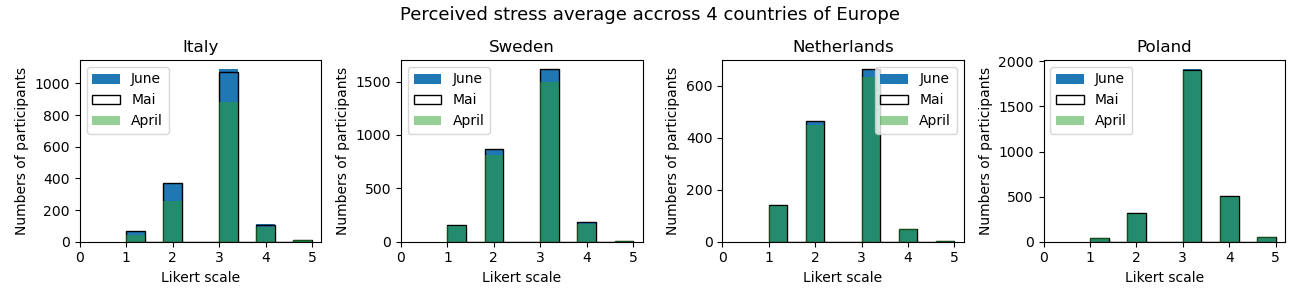
We observe a median of 3 on the likert scale, indicating that there is indeed a mild feeling of loneliness and stress in each country. However, is it because of the mobility restriction in each country? For that, visualization wasn't enough to see any difference between the 3 month period of the survey and we needed to use a hypothesis test.
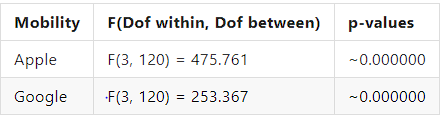
We performed ANOVA to compare the effect of Countries and periods of time of the survey on the perceived mental issues. ANOVA tests showed that there was not a statistically significant difference in both stress and loneliness perception between the different periods of time of the survey.
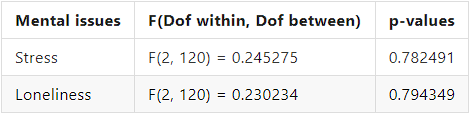
Concerning difference between countries, we observe a statistically significant results.
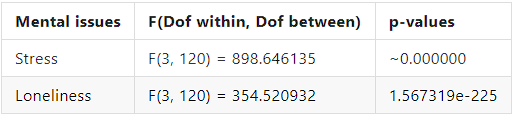
Lastly, we take a look at the difference within the countries using Conover test, a Post hoc test. The test shows a statistically significant difference between all countries in terms of stress perception in all pairs except Sweden and the Netherlands for loneliness.
Did we answer the question?
We hoped Covidistress dataset would help us find a link between number of pageviews and real mental health issues, however, we did not find any signifact evidence backing up our hypothesis. This might have been caused by the limitations of the dataset itself, which we discuss in the next section. However, it showed us that there is still a mild stress and loneliness perceived in those countries, although we can't conclude if there is a significant change over the considered period or if any change is due to mobility.
Downfalls and Limitations
Limitations of Wikipedia Pageviews
When workign with Wikipedia pageviews it's very important to understand the nature of the data you're working with. Indeed during Ebola outbreak a large amount of traffic was generated for the english Wikipedia page about Ebola, but actually there has only been a total of 11 diagnosed Ebola cases. So pageviews for a disease do not necessarily correlate with the real world situtation
" The key is trying to understand the particular context of the disease and country in question each time — rather that blindly assuming Wikipedia data captures it perfectly. Each time, you have to ask some questions, "What are the biases in the data? What types of people are searching for their diseases? What do those searches really mean?" " [1]
COVIDiSTRESS limitation
The limititation of Covidistress data are that the survey targetted only Stress and Loneliness as mental health issues which only corresponded to 40% of our target ones. Moreover, there is a problem of likert scale questions, which have a hard time grasping the true fealings of person due to the limited answer options. Lastly the observed period is quite short - e.g. there is no data from before the lockdown.
Conclusion
In our analysis we addressed several questions relating to how COVID-19 may have affected mental health, and we assumed Wikipedia pageviews for pages on specific mental health issues can act as proxy for awareness or interrest in those issues.
Firsly, we have shown using the difference in differences regression method that there is a significant change in pageviews for 8 disease-country pairs during the first lockdown period compared to the same period in 2019. Secondly, using linear regression we were able to show that a decrease in mobility correlates with an increase in pageviews for several of the chosen mental health issues, and furthermore that this simple model fits especially well for loneliness, and stress pageviews. Finally we attempted to show a connection between pageviews and real mental health issues for each country using ANOVA, however, we were not able to find significant evidence for this hypothesis. We think it might have been caused by the limitation of COVIDiSTRESS dataset. In future it might be worthwhile to analyze the link to real mental health issues with more precise data than what COVIDiSTRESS has to offer.